Providence Ranked Worst in State for Recycling
Wednesday, April 23, 2014
Kate Nagle, GoLocal Contributor
Data released by the Rhode Island Resource Recovery Corporation (RIRRC) shows that for 2013, Providence had the lowest recycling rates in the state of Rhode Island.
In information provided by the RIRRC entitled "How's My City or Town Doing?," numbers show that furthermore recycling has gone down in Providence between 2011 and 2013, which includes the Materials Recycling Facility (MRF) rate, the mandatory recycling rate, and the rate of overall material diversion from the landfill.
SLIDES: See How Your City or Town Ranks for Recycling BELOW
On Tuesday, Providence Mayor Angel Taveras unveiled a “Preserving Rhode Island" plan to addresses environmental issues such as climate change, reducing Rhode Island’s carbon footprint and waste management on a statewide level.
GET THE LATEST BREAKING NEWS HERE -- SIGN UP FOR GOLOCAL FREE DAILY EBLAST
"Providence continues to struggle with contamination. The drivers for Waste Management (the city’s hauling vendor) examine each load as it’s being collected, and they decide whether or not the load meets our criteria. Some loads are directed straight to the landfill because they’re too contaminated. Some go to the materials recycling facility (MRF), where they are further examined. At least once a day, a Providence load is rejected at the MRF," said Sarah Kite, RIRRC Executive Director. "The cost for rejected loads will increase as of July 1, 2014, so the costs for the city will most certainly increase unless they are able to fully address the problems. The main contaminants continue to be food waste, textiles, and construction and demolition debris."
The Mayor's office did not respond to request for comment Tuesday on recycling.
Providence Issues
Last July,
GoLocal reported that while Providence predicted that the "big green can" recycling initiative would save the city $250K, Tim Faulker with EcoRI pointed out that RIRRC said that contaminated recycling would cost the city $100K in 2013.
"There are many reasons why recycling in urban areas is a challenge, and [it is] is common. There are dozens of different languages spoken in Providence every day. This makes communicating recycling rules challenging. There is a high preponderance of multi-family dwellings. There is a high degree of mobility within the population-people flow in and out of the city with regularity. There are cultural biases regarding recycling," said Kite.
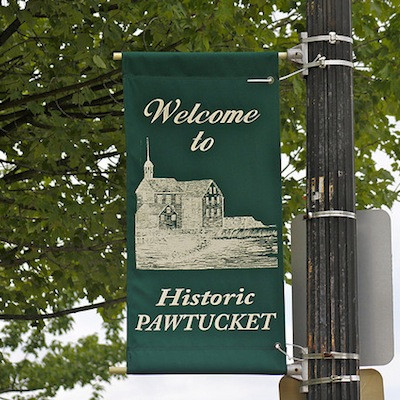
"All of these issues, plus others, create a very challenging environment when it comes to informing and engaging residents on how to recycle and why it’s important. However, it can be done. Pawtucket is experiencing some challenges as well, as is Cranston. But Pawtucket has had some impressive successes. The Pawtucket Housing Authority recently launched a successful campaign in one of their larger complexes, and have realized 100% participation in the program-unprecedented."
Leading by Example
The most successful program in RI is Middletown’s. Middletown has automated trash and recycling collection (meaning, they use 65-gallon carts instead of standard trash barrels and small bins), and they use a Pay as You Throw system for trash. Pay as You Throw (PAYT) is the most successful system for decreasing trash and increasing recycling. There are over 7,000 communities across the country that use PAYT, and each showed increased recycling over their previous system for paying for trash services. With PAYT, instead of the city or town paying for the cost of trash services, the person that generates the trash does. So, instead of paying for trash collection in my taxes, I’d pay for it through by buying special trash bags. Most PAYT systems that use special bags charge a fee for the bag that wraps the cost of disposal and collection into the fee. Some price the bag to cover only disposal costs, others use it to cover all costs associated with trash collection. While there’s a charge for the trash bag, there’s no charge for recycling" said Kite.
"What this does is it incentivizes recycling, composting and reuse, because people don’t want to put anything in the paid-for bag that can go in the free recycling. In PAYT communities, if you don’t use the specific PAYT bag, your trash isn’t collected, and in some cases, you are charged a fine. In PAYT communities, there is usually additional opportunities to recycle the hard-to-handle materials, like furniture and bulky plastics"
Related Slideshow: RI Recycling Rates by Town - 2011 to 2013
 View Larger +
Prev
Next
#38. Providence
Rate of Overall Material Diversion
2013: 17.4%
2011: 18.2%
Mandatory Recycling Rate
2013: 16.9%
2011: 18.0%
MRF Recycling Rate
2013: 13.3%
2011: 14.6%
Tons of Trash Sent to Landfill Per Household
2013: 0.96
2011: 0.94
 View Larger +
Prev
Next
#37. Johnston
Rate of Overall Material Diversion
2013: 18.7%
2011: 18.7%
Mandatory Recycling Rate
2013: 18.4%
2011: 18.3%
MRF Recycling Rate
2013: 12.9%
2011: 12.2%
Tons of Trash Sent to Landfill Per Household
2013: 1.41
2011: N/A
 View Larger +
Prev
Next
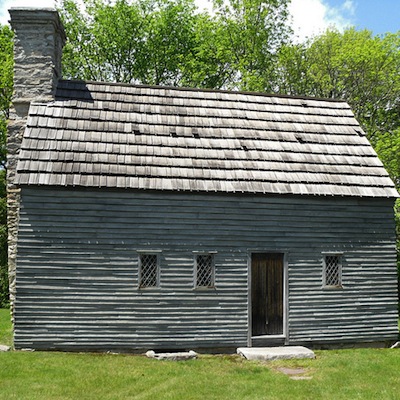
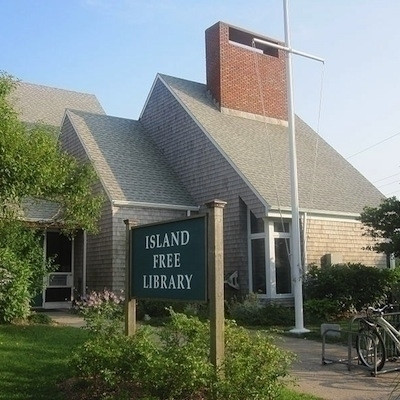
#36. New Shoreham
Rate of Overall Material Diversion
2013: 21.3%
2011: 46.4%
Mandatory Recycling Rate
2013: 20.8%
2011: 31.6%
MRF Recycling Rate
2013: 20.8%
2011: 23.1%
Tons of Trash Sent to Landfill Per Household
2013: N/A
2011: N/A
 View Larger +
Prev
Next
#35. Foster
Rate of Overall Material Diversion
2013: 23.8%
2011: 22.6%
Mandatory Recycling Rate
2013: 22.8%
2011: 21.7%
MRF Recycling Rate
2013: 22.7%
2011: 21.7%
Tons of Trash Sent to Landfill Per Household
2013: 1.07
2011: 1.15
 View Larger +
Prev
Next
#34. Central Falls
Rate of Overall Material Diversion
2013: 25.0%
2011: 22.9%
Mandatory Recycling Rate
2013: 24.5%
2011: 22.4%
MRF Recycling Rate
2013: 22.2%
2011: 20.3%
Tons of Trash Sent to Landfill Per Household
2013: 0.82
2011: 0.72
 View Larger +
Prev
Next
#33. Warren
Rate of Overall Material Diversion
2013: 28.1%
2011: 40.2%
Mandatory Recycling Rate
2013: 27.4%
2011: 28.9%
MRF Recycling Rate
2013: 20.1%
2011: 25.2%
Tons of Trash Sent to Landfill Per Household
2013: 1.00
2011: 0.65
 View Larger +
Prev
Next
#32.Scituate
Rate of Overall Material Diversion
2013: 28.2%
2011: 25.3%
Mandatory Recycling Rate
2013: 27.8%
2011: 24.6%
MRF Recycling Rate
2013: 24.9%
2011: 22.1%
Tons of Trash Sent to Landfill Per Household
2013: 0.84
2011: 0.99
 View Larger +
Prev
Next
#31. Lincoln
Rate of Overall Material Diversion
2013: 28.7%
2011: 27.7%
Mandatory Recycling Rate
2013: 28.2%
2011: 27.8%
MRF Recycling Rate
2013: 22.4%
2011: 21.5%
Tons of Trash Sent to Landfill Per Household
2013: 1.17
2011: 1.23
 View Larger +
Prev
Next
#30. Pawtucket
Rate of Overall Material Diversion
2013: 28.7%
2011: 31.1%
Mandatory Recycling Rate
2013: 27.7%
2011: 27.6%
MRF Recycling Rate
2013: 21.2%
2011: 20.0%
Tons of Trash Sent to Landfill Per Household
2013: 0.58
2011: 0.61
 View Larger +
Prev
Next
#29. Cumberland
Rate of Overall Material Diversion
2013: 29.2%
2011: 36.4%
Mandatory Recycling Rate
2013: 28.8%
2011: 36.2%
MRF Recycling Rate
2013: 23.6%
2011: 19.9%
Tons of Trash Sent to Landfill Per Household
2013: 0.95
2011: 1.20
 View Larger +
Prev
Next
#28. Little Compton
Rate of Overall Material Diversion
2013: 29.5%
2011: 36.5%
Mandatory Recycling Rate
2013: 28.1%
2011: 30.9%
MRF Recycling Rate
2013: 28.1%
2011: 26.7%
Tons of Trash Sent to Landfill Per Household
2013: 0.73
2011: 1.08
 View Larger +
Prev
Next
#27. Coventry
Rate of Overall Material Diversion
2013: 31.6%
2011: 30.7%
Mandatory Recycling Rate
2013: 31.4%
2011: 30.3%
MRF Recycling Rate
2013: 22.7%
2011: 21.5%
Tons of Trash Sent to Landfill Per Household
2013: 1.03
2011: 1.06
 View Larger +
Prev
Next
#26. West Warwick
Rate of Overall Material Diversion
2013: 32.2%
2011: 31.4%
Mandatory Recycling Rate
2013: 31.7%
2011: 31.1%
MRF Recycling Rate
2013: 20.5%
2011: 21.0%
Tons of Trash Sent to Landfill Per Household
2013: 0.92
2011: 0.96
 View Larger +
Prev
Next
#25. West Greenwich
Rate of Overall Material Diversion
2013: 32.5%
2011: 26.1%
Mandatory Recycling Rate
2013: 31.0%
2011: 24.6%
MRF Recycling Rate
2013: 26.6%
2011: 20.6%
Tons of Trash Sent to Landfill Per Household
2013: 1.20
2011: 1.51
 View Larger +
Prev
Next
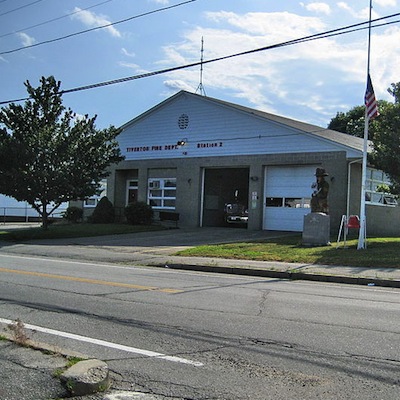
#24. Tiverton
Rate of Overall Material Diversion
2013: 33.3%
2011: 54.9%
Mandatory Recycling Rate
2013: 32.6%
2011: 54.6%
MRF Recycling Rate
2013: 29.2%
2011: 28.5%
Tons of Trash Sent to Landfill Per Household
2013: 0.75
2011: 1.03
 View Larger +
Prev
Next
#23. North Providence
Rate of Overall Material Diversion
2013: 33.7%
2011: 28.5%
Mandatory Recycling Rate
2013: 33.1%
2011: 27.8%
MRF Recycling Rate
2013: 23.4%
2011: 21.4%
Tons of Trash Sent to Landfill Per Household
2013: 0.77
2011: 0.89
 View Larger +
Prev
Next
#22. Westerly/Hopkinton
Rate of Overall Material Diversion
2013: 33.8%
2011: 35.3%
Mandatory Recycling Rate
2013: 32.3%
2011: 24.0%
MRF Recycling Rate
2013: 21.0%
2011: 15.3%
Tons of Trash Sent to Landfill Per Household
2013: 1.43
2011: 1.64
View Larger +
Prev
Next
#21. Jamestown
Rate of Overall Material Diversion
2013: 33.9%
2011: 28.1%
Mandatory Recycling Rate
2013: 33.1%
2011: 27.4%
MRF Recycling Rate
2013: 30.6%
2011: 25.9%
Tons of Trash Sent to Landfill Per Household
2013: 2.23
2011: 2.24
 View Larger +
Prev
Next
#20. Woonsocket
Rate of Overall Material Diversion
2013: 34.0%
2011: 33.0%
Mandatory Recycling Rate
2013: 32.2%
2011: 31.6%
MRF Recycling Rate
2013: 24.6%
2011: 23.7%
Tons of Trash Sent to Landfill Per Household
2013: 0.86
2011: 0.88
 View Larger +
Prev
Next
#19. Exeter
Rate of Overall Material Diversion
2013: 34.0%
2011: 33.0%
Mandatory Recycling Rate
2013: 32.2%
2011: 31.6%
MRF Recycling Rate
2013: 24.6%
2011: 23.7%
Tons of Trash Sent to Landfill Per Household
2013: 0.86
2011: 0.88
 View Larger +
Prev
Next
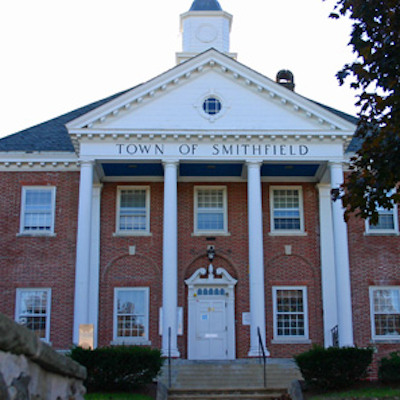
#18. Smithfield
Rate of Overall Material Diversion
2013: 35.7%
2011: 38.4%
Mandatory Recycling Rate
2013: 35.4%
2011: 38.0%
MRF Recycling Rate
2013: 26.7%
2011: 24.8%
Tons of Trash Sent to Landfill Per Household
2013: 0.87
2011: 0.72
 View Larger +
Prev
Next
#17. Glocester
Rate of Overall Material Diversion
2013: 36.2%
2011: 36.8%
Mandatory Recycling Rate
2013: 33.6%
2011: 34.4%
MRF Recycling Rate
2013: 33.6%
2011: 31.1%
Tons of Trash Sent to Landfill Per Household
2013: 0.78
2011: 0.86
 View Larger +
Prev
Next
#16. Newport
Rate of Overall Material Diversion
2013: 37.6%
2011: 36.0%
Mandatory Recycling Rate
2013: 37.2%
2011: 35.7%
MRF Recycling Rate
2013: 23.6%
2011: 22.9%
Tons of Trash Sent to Landfill Per Household
2013: 0.74
2011: 0.92
 View Larger +
Prev
Next
#15. Cranston
Rate of Overall Material Diversion
2013: 37.7%
2011: 36.0%
Mandatory Recycling Rate
2013: 36.9%
2011: 35.7%
MRF Recycling Rate
2013: 24.3%
2011: 22.4%
Tons of Trash Sent to Landfill Per Household
2013: 0.83
2011: 0.88
 View Larger +
Prev
Next
#14. Richmond
Rate of Overall Material Diversion
2013: 38.0%
2011: 24.7%
Mandatory Recycling Rate
2013: 37.1%
2011: 23.3%
MRF Recycling Rate
2013: 37.1%
2011: 23.3%
Tons of Trash Sent to Landfill Per Household
2013: N/A
2011: N/A
 View Larger +
Prev
Next
#13. Bristol
Rate of Overall Material Diversion
2013: 38.2%
2011: 23.5%
Mandatory Recycling Rate
2013: 37.7%
2011: 17.7%
MRF Recycling Rate
2013: 17.4%
2011: 17.7%
Tons of Trash Sent to Landfill Per Household
2013: 1.32
2011: N/A
 View Larger +
Prev
Next
#12. Burrillville
Rate of Overall Material Diversion
2013: 38.3%
2011: 30.2%
Mandatory Recycling Rate
2013: 36.7%
2011: 28.9%
MRF Recycling Rate
2013: 31.4%
2011: 22.6%
Tons of Trash Sent to Landfill Per Household
2013: 0.70
2011: 0.83
 View Larger +
Prev
Next
#11. North Smithfield
Rate of Overall Material Diversion
2013: 38.5%
2011: 37.2%
Mandatory Recycling Rate
2013: 37.8%
2011: 36.6%
MRF Recycling Rate
2013: 31.9%
2011: 30.6%
Tons of Trash Sent to Landfill Per Household
2013: 0.76
2011: 0.81
 View Larger +
Prev
Next
#10. East Greenwich
Rate of Overall Material Diversion
2013: 39.4%
2011: 38.2%
Mandatory Recycling Rate
2013: 39.2%
2011: 36.5%
MRF Recyling Rate
2013: 29.4%
2011: 28.5%
Tons of Trash Sent to Landfill Per Household
2013: 0.98
2011: 1.02
 View Larger +
Prev
Next
#9. Narragansett
Rate of Overall Material Diversion
2013: 39.5%
2011: 42.3%
Mandatory Recycling Rate
2013: 36.9%
2011: 22.8%
MRF Recycling Rate
2013: 36.9%
2011: 16.9%
Tons of Trash Sent to Landfill Per Household
2013: 0.37
2011: N/A
 View Larger +
Prev
Next
#8. Charlestown
Rate of Overall Material Diversion
2013: 42.6%
2011: 44.1%
Mandatory Recycling Rate
2013: 40.3%
2011: 42.4%
MRF Recycling Rate
2013: 33.6%
2011: 33.6%
Tons of Trash Sent to Landfill Per Household
2013: 0.42
2011: 0.41
 View Larger +
Prev
Next
#7. North Kingstown
Rate of Overall Material Diversion
2013: 43.4%
2011: 36.4%
Mandatory Recycling Rate
2013: 41.5%
2011: 33.5%
MRF Recycling Rate
2013: 41.5%
2011:29.4%
Tons of Trash Sent to Landfill Per Household
2013: 1.11
2011: 1.32
 View Larger +
Prev
Next
#6. East Providence
Rate of Overall Material Diversion
2013: 47.8%
2011: 48.5%
Mandatory Recycling Rate
2013: 47.5%
2011: 48.2%
MRF Recycling Rate
2013: 26.2%
2011:24.7%
Tons of Trash Sent to Landfill Per Household
2013: 0.82
2011: 0.83
 View Larger +
Prev
Next
#5. Warwick
Rate of Overall Material Diversion
2013: 49.3%
2011: 46.3%
Mandatory Recycling Rate
2013: 49.1%
2011: 46.1%
MRF Recycling Rate
2013: 29.3%
2011:26.0%
Tons of Trash Sent to Landfill Per Household
2013: 0.87
2011: 0.93
 View Larger +
Prev
Next
#4. Portsmouth
Rate of Overall Material Diversion
2013: 50.0%
2011: 44.2%
Mandatory Recycling Rate
2013: 45.0%
2011: 40.3%
MRF Recycling Rate
2013: 45.0%
2011:30.0%
Tons of Trash Sent to Landfill Per Household
2013: 0.95
2011: 1.07
 View Larger +
Prev
Next
#3. Barrington
Rate of Overall Material Diversion
2013: 50.9%
2011: 49.3%
Mandatory Recycling Rate
2013: 50.6%
2011: 48.6%
MRF Recycling Rate
2013: 29.4%
2011: 27.1%
Tons of Trash Sent to Landfill Per Household
2013: 0.97
2011: 0.97
 View Larger +
Prev
Next
#2. Middletown
Rate of Overall Material Diversion
2013: 54.1%
2011: 53.5%
Mandatory Recycling Rate
2013: 53.7%
2011: 52.3%
MRF Recycling Rate
2013: 41.9%
2011: 40.8%
Tons of Trash Sent to Landfill Per Household
2013: 0.55
2011: 0.56
 View Larger +
Prev
Next
#1. South Kingstown
Rate of Overall Material Diversion
2013: 54.5%
2011: 63.1%
Mandatory Recycling Rate
2013: 51.4%
2011: 50.6%
MRF Recycling Rate
2013: 40.0%
2011: 42.4%
Tons of Trash Sent to Landfill Per Household
2013: 0.39
2011 :0.42
Related Articles
Enjoy this post? Share it with others.