

RI Has Highest Percentage of Deficient Bridges in Country
Russell J. Moore, GoLocalProv MINDSETTER™
RI Has Highest Percentage of Deficient Bridges in Country
Of the state's 766 bridges, 429 of them are considered deficient according to federal statistics. That's 56 percent of the state's bridges.
That puts the state well ahead of the national average. On a national level, roughly 24 percent of the bridges in the country are considered deficient.
GET THE LATEST BREAKING NEWS HERE -- SIGN UP FOR GOLOCAL FREE DAILY EBLASTThere are 610,749, bridges in the nation, and 145,890 are considered deficient.
Neighboring Massachusetts ranks a close second, with 52 percent of its 5,141 bridges being considered as having some level of deficiency. New York came a distant third place in the category of most deficient bridges in the country, with 39 percent of its 17,456 bridges being considered deficient.
About 23 percent of the state's bridges are considered "structurally deficient". Structurally deficient generally means that the condition of the bridge contains a significant defect. To be considered structurally deficient, a bridge's deck, superstructures, substructures, or culvert and retaining wall must receive sub-optimal ratings from inspectors.
There are 174 bridges in the state that are considered structurally deficient.
Functionally Deficient or Obsolete
Another 255 of the state's bridges are considered "functionally obsolete". Functionally obsolete generally means that the bridge in question is not sufficient to meet the use of what it was designed for--meaning it may lack the proper deck geometry, or the proper under-clearances, for instance. That means 33 percent of the state's bridges are considered functionally obsolete.
Neither rating, structurally deficient or functionally obsolete, mean that the bridge is unsafe for travel.
But if a bridge is considered either structurally deficient, or structurally obsolete, it is considered "deficient", according to federal data.
The vast majority of the state's deficient bridges are over 40 years old, according to the data.
The American Road and Transportation Builders Association recently released a list of the most traveled, deficient bridges in each state.
See The Most Dangerous Bridges In Rhode Island Below
Calls left at the state DOT communications office over the course of two days were not returned. Peter Alviti, the new DOT Director, has commented to other media outlets that he's very concerned about the condition of the state's bridges.
"A Bridge To Everywhere"
"The most critical element of bridge condition, however, is the level of investment made in ongoing maintenance. In Rhode Island, decreasing gas tax revenue, limited funding sources, and increasing debt service costs have led to a decline in the investment in Rhode Island’s roads and bridges. Simply put, Rhode Island hasn't been able to keep up with the needs of the aging infrastructure," the report states.
The report called for funding a state-funded capital program to supplement the gas tax and federal funding the state receives, saying that the gas tax is "simply not enough".
When certain taxpayer advocates hear that, they immediately think "tax increases".
"Raising taxes to fund bridge and road maintenance is not an option as Rhode Island already has high taxes," said Monique Chartier, a spokesperson from the Rhode Island Taxpayers association.
"Decades of poor policy decisions and bad spending priorities by prior General Assemblies have resulted in the deterioration of Rhode Island's bridges and roads. It has also left current elected officials with no easy options for catching up on years of deferred maintenance. If officials determine to increase spending on bridges and roads, every spending line item in the state budget must be closely examined for reductions so as to find room for this new spending."
Tax Increases on Horizon?
Chartier said that instead of spending money on a new baseball stadium in Providence, the state should invest in infrastructure instead.
Justin Katz, the research director of the Rhode Island Center for Freedom and Prosperity, agreed.
"In our view, roads and bridges are among the fundamental duties within the scope of government. They should therefore be among the first expenses covered within the budget," said Katz.
"There are plenty of areas within state spending that could be reduced to cover spending on infrastructure, from curtailing activities that are not within government's scope, to controlling disproportionate labor costs, to addressing the overzealous weaving of what's supposed to be a safety net into a web of dependency."
COVER PHOTO: Providence Public Library via Flckr
RI's Most Dangerous Bridges

10.
US-6 eastbound and westbound over US-6A/Hartford Avenue.
52,678 daily crossings
The bridge is structurally deficient

9.
RI-146/Ed Dowl Highway over RI-246/Charles Street.
72,800 daily crossings
The bridge is structurally deficient

8.
RI-146/Ed Dowl Highway over RI-15/Mineral Spring Avenue.
72,800 daily crossings
The bridge is structurally deficient

7.
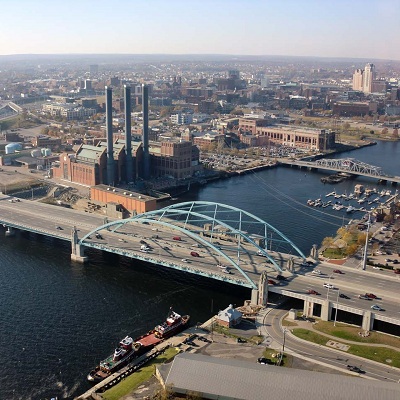
I-195 westbound over the Seekonk River.
76,700 daily crossings
The bridge is structurally deficient

6.
I-95 northbound and southbound over RI-2/Quaker Lane.
77,800 daily crossings
The bridge is structurally deficient

5.
I-95 northbound and southbound over Wellington Avenue.
147,984 daily crossings
The bridge is structurally deficient

4.
I-95 northbound and southbound over Jefferson Boulevard.
156,400 daily crossings
The bridge is structurally deficient

3.
I-95 northbound and southbound over Amtrak.
159,200 daily crossings
The bridge is structurally deficient
2.
Broad Street over I-95 northbound and southbound and the P&W Railroad.
179,600 daily crossings
The bridge is structurally deficient
1.
Interstate 95 northbound and southbound over US-1 (Elmwood Avenue).
186,500 daily crossing
The bridge is structurally deficient


