

If Providence Schools Are in Crisis — See the Other RI School Systems with Similar Performance
GoLocalProv News Team
If Providence Schools Are in Crisis — See the Other RI School Systems with Similar Performance

At Joseph Jenks Middle School in Pawtucket, only 8 percent of students are meeting or exceeding expectations for English Language Arts (ELA). Math results are even worse — just 6.45% meet or exceed expectations.
The Pawtucket school's performance is similar to many of Providence’s lowest-performing middle schools.
GET THE LATEST BREAKING NEWS HERE -- SIGN UP FOR GOLOCAL FREE DAILY EBLASTSLIDES: See Middle Schools Across RI With Similar Performance to Providence's "Crisis" Schools BELOW
Rhode Island Commissioner of Education Angélica Infante-Green told GoLocal in a phone interview that she understands there are problem areas around the state.
“I have only been on the job for two months,” said Infante-Green. “We have work to do everywhere - we are starting in Providence” in discussing the education challenges that litter the state, after Providence's schools were deemed "broken" and in "crisis" following the Johns Hopkins report.
When asked if Rhode Island students and their families have a right to an education, Infante-Green said, "Kids should have a quality education." She would not commit, however, to a legal right to an education.
GoLocal found 16 middle schools in Rhode Island in which 80% of the students either failed to meet expectations or only partially meet expectations on last year's RICAS test for either English Language Arts (ELA) or Math, but in most cases both.
According to Education Week, California researchers found that schools who moved from dilapidated buildings into new schools saw dramatic improvement.
But it did not have the desired effect in Woonsocket.
Most disturbing is that in 2009 the State of Rhode and Woonsocket invested more than $80 million to build a “state-of-the-art" middle school complex — replacing the largest middle school in New England which housed approximately 2,000 students. The old building was built in 1914.
The bonds were originally issued in 2009 to finance the $74 million cost of building the Woonsocket Middle School buildings on Hamlet Avenue.
The two gleaming middle school buildings were built on a former contaminated mill complex and the investment promised a new opportunity for an improved learning experience — but less than a decade later, the two Woonsocket middle schools are performing as badly as many of the Providence Public Schools.
At the better of the two performing Woonsocket middle schools — Villa Nova — just ten percent of the students meet or exceed expectations for ELA (9.8% meet expectations and 0.48% exceed expectations) and for Math 6.7% meet expectations —none exceeded expectations.
At the poorer performing middle school in Woonsocket — Hamlet — only 8.5% meet or exceed expectations for ELA. For math, the Woonsocket Middle School Hamlet building had only 6.8% meet expectations and like the other Woonsocket Middle School, no students exceeded expectations.
In California, researchers Julien Lafortune and David Scönholzer “tracked the individual test scores, classroom grades, and attendance rates of more than 5 million individual Los Angeles Unified School District students between 2002 and 2012, before and after those same students moved from overcrowded, dilapidated schools to new facilities,” reported Education Week.
The researchers concluded that the $10 billion-plus, multiyear school construction effort had “a positive academic impact on students.”
Providence Out Performed by Newark City
According to Johns Hopkins University’s assessment of Providence middle schools, the middle schools are performing as badly as Newark City, New Jersey, but that community is showing improvement while Providence is further declining.
"..the trendlines for ELA in Newark, Providence, and Rhode Island over the past four years. It is clear that Providence is well below both Newark and the state of Rhode Island; only Newark presents a positive overall trend in ELA. However, the negative trend in Providence is steeper, indicating that students are declining more quickly there than they are in the state of Rhode Island as a whole," wrote the Johns Hopkins report.
- Providence schools scored lower than comparable districts (Newark City and Worcester) in both ELA and math in all grades across all years examined.
- While most grades in Providence saw relatively stable proficiency rates over time in ELA, 8th grade appears to be an especially difficult time as proficiency rates steadily decreased over time.
- 8th grade also appears to be a particularly difficult time for students in mathematics, as this was the grade with lowest proficiency rates in Providence over each of the four years.
Infante-Green said that in Providence there are students that have not had math instruction in two years.
Editor's note: an earlier version Ferri Middle School as being in Cranston, the school is in Johnston. We apologize for the error.
Rhode Island's Worst Performing Middle Schools - July 1, 2019

Johnston
Nicholas Feri Middle School
Not Meeting Expectation: ELA 27% Math 22%
Partially Meeting Expectations: ELA 54% Math 61%
Meeting Expectation: ELA 18% Math 16%
Exceeding Expectations: ELA 1 Math <1
Cranston
Hugh Bain Middle School
Not Meeting Expectation: ELA 37% Math 38%
Partially Meeting Expectations: ELA 52% Math 54%
Meeting Expectation: ELA 11% Math 8%
Exceeding Expectations: ELA <1 Math <1

Woonsocket
Woonsocket Middle School - Hamlet
Not Meeting Expectation: ELA 45% Math 45%
Partially Meeting Expectations: ELA 46% Math 48%
Meeting Expectation: ELA 8% Math 7%
Exceeding Expectations: ELA <1% Math 0
Woonsocket
Woonsocket Middle School - Villa Nova
Not Meeting Expectation: ELA 41% Math 40%
Partially Meeting Expectations: ELA 49% Math 54%
Meeting Expectation: ELA 10% Math 7%
Exceeding Expectations: ELA <1% Math 0

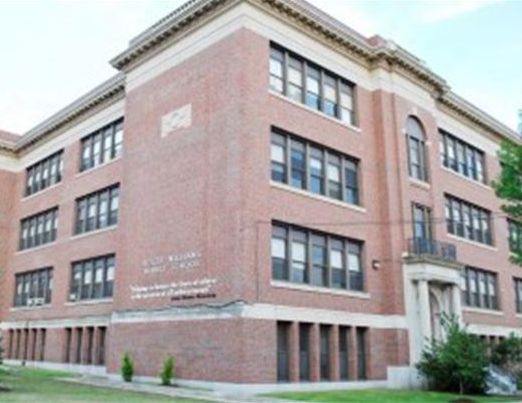
Providence
Roger Williams Middle School
Not Meeting Expectation: ELA 60% Math 56%
Partially Meeting Expectations: ELA 36% Math 41%
Meeting Expectation: ELA 4% Math 2%
Exceeding Expectations: ELA 0 Math 0

Pawtucket
Samuel Slater Middle School
Not Meeting Expectation: ELA 48% Math 40%
Partially Meeting Expectations: ELA 44% Math 53%
Meeting Expectation: ELA 6% Math 7%
Exceeding Expectations: ELA <1 Math <1
Pawtucket
Joseph Jenks Middle School
Not Meeting Expectation: ELA 44% Math 37%
Partially Meeting Expectations: ELA 47% Math 56%
Meeting Expectation: ELA 8% Math 6%
Exceeding Expectations: ELA <1 Math <1

Central Falls
Dr. Earl E. Calcutt Middle School
Not Meeting Expectation: ELA 55% Math 59%
Partially Meeting Expectations: ELA 38% Math 37%
Meeting Expectation: ELA 6% Math 4%
Exceeding Expectations: ELA <1 Math 0
Has been under state management for approximately 20+ years
Providence
Esek Hopkins Middle School
Not Meeting Expectation: ELA 49% Math 45%
Partially Meeting Expectations: ELA 43% Math 51%
Meeting Expectation: ELA 8% Math 4%
Exceeding Expectations: ELA <1 Math 0
Providence
Gilbert Stuart Middle School
Not Meeting Expectation: ELA 60% Math 56%
Partially Meeting Expectations: ELA 36% Math 41%
Meeting Expectation: ELA 3% Math 3%
Exceeding Expectations: ELA 0 Math 0
Providence
Governor Chris DelSesto Middle School
Not Meeting Expectation: ELA 64% Math 56%
Partially Meeting Expectations: ELA 33% Math 41%
Meeting Expectation: ELA 3% Math 3%
Exceeding Expectations: ELA <1 Math 0
Providence
Nathan Bishop Middle School
Not Meeting Expectation: ELA 51% Math 50%
Partially Meeting Expectations: ELA 35% Math 40%
Meeting Expectation: ELA 13% Math 10%
Exceeding Expectations: ELA 1 Math <1
Providence
West Broadway Middle School
Not Meeting Expectation: ELA 52% Math 52%
Partially Meeting Expectations: ELA 42% Math 42%
Meeting Expectation: ELA 6% Math 6%
Exceeding Expectations: ELA <1 Math <1
Charter
Paul Cuffie
Not Meeting Expectation: ELA 23% Math 22%
Partially Meeting Expectations: ELA 59% Math 59%
Meeting Expectation: ELA 17% Math 19%
Exceeding Expectations: ELA <1 Math 1
Test results are for the entire school, not just the middle school
Newport
Frank E. Thompson Middle School
Not Meeting Expectation: ELA 30% Math 28%
Partially Meeting Expectations: ELA 47% Math 53%
Meeting Expectation: ELA 21% Math 19%
Exceeding Expectations: ELA 1 Math <1

West Warwick
John F. Deering Middle School
Not Meeting Expectation: ELA 23% Math 27%
Partially Meeting Expectations: ELA 55% Math 57%
Meeting Expectation: ELA 22% Math 16%
Exceeding Expectations: ELA <1 Math <1


