

NEW: Councilman Jackson Will Retain 3rd Ward Council Seat
GoLocalProv News Team
NEW: Councilman Jackson Will Retain 3rd Ward Council Seat
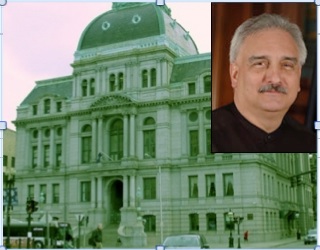
After machine's Elorza's candidate had a slight advantage -- Marcus Mitchell.
Machine Count:
GET THE LATEST BREAKING NEWS HERE -- SIGN UP FOR GOLOCAL FREE DAILY EBLASTWRITE-IN 1829 ( 50% )
Kevin E. JACKSON(DEM) 1807 ( 49% )
Now, after a recount of ballots and a count of mail ballots, Jackson has taken an "unsurpassable" lead of 1,942 votes for Jackson to 1,864 votes for Mitchell.
Some ballots are disputed, but Jackson's legal team tells GoLocal that this lead will hold and Mitchell is most likely to lose votes.
Jackson is poised to become the Council Majority Leader and he and Councilman Luis Aponte have teamed to take control of the Providence City Council.
Mayor-elect Elorza may now be facing a City Council looking to extract a little revenge.
Jackson has served as Councilman in the Third Ward since 1995.
Providence's Most Violent Neighborhoods

#9: District 9
College Hill, Wayland Square, Fox Point
Violent Crimes Reported (YTD)
2013: 35
2012: 53
Property Crimes Reported (YTD)
2013: 597
2012: 630
Other Crimes Reported (YTD)
2013: 183
2012: 218
Total Crimes Reported (YTD)
2013: 815
2012: 901
#8: District 8
Mount Hope, Hope, Blackstone
Violent Crimes Reported (YTD)
2013: 36
2012: 40
Property Crimes Reported (YTD)
2013: 596
2012: 531
Other Crimes Reported (YTD)
2013: 226
2012: 212
Total Crimes Reported (YTD)
2013: 858
2012: 783
#7: District 3
Reservoir, South Elmwood, Washington Park
Violent Crimes Reported (YTD)
2013: 63
2012: 67
Property Crimes Reported (YTD)
2013: 443
2012: 452
Other Crimes Reported (YTD)
2013: 311
2012: 305
Total Crimes Reported (YTD)
2013: 817
2012: 824
#6: District 1
Downtown
Violent Crimes Reported (YTD)
2013: 79
2012: 94
Property Crimes Reported (YTD)
2013: 1116
2012: 1118
Other Crimes Reported (YTD)
2013: 563
2012: 580
Total Crimes Reported (YTD)
2013: 1758
2012: 1792
#5: District 6
Mount Pleasant, Manton, Elmhurst
Violent Crimes Reported (YTD)
2013: 128
2012: 116
Property Crimes Reported (YTD)
2013: 829
2012: 885
Other Crimes Reported (YTD)
2013: 531
2012: 559
Total Crimes Reported (YTD)
2013: 1488
2012: 1560
#4: District 7
Charles, Wanskuck, Smith Hill
Violent Crimes Reported (YTD)
2013: 172
2012: 183
Property Crimes Reported (YTD)
2013: 1143
2012: 1092
Other Crimes Reported (YTD)
2013: 784
2012: 813
Total Crimes Reported (YTD)
2013: 2099
2012: 2088
#3: District 4
Federal Hill, West End
Violent Crimes Reported (YTD)
2013: 173
2012: 188
Property Crimes Reported (YTD)
2013: 1082
2012: 1085
Other Crimes Reported (YTD)
2013: 755
2012: 919
Total Crimes Reported (YTD)
2013: 2010
2012: 2192

#2: District 5
Olneyville, Silver Lake, Hartford
Violent Crimes Reported (YTD)
2013: 206
2012: 189
Property Crimes Reported (YTD)
2013: 911
2012: 865
Other Crimes Reported (YTD)
2013: 758
2012: 724
Total Crimes Reported (YTD)
2013: 1875
2012: 1778
#1: District 2
Upper South Providence, Lower South Providence, Elmwood
Violent Crimes Reported (YTD)
2013: 213
2012: 188
Property Crimes Reported (YTD)
2013: 966
2012: 964
Other Crimes Reported (YTD)
2013: 841
2012: 910
Total Crimes Reported (YTD)
2013: 2020
2012: 2062

Citywide
Violent Crimes Reported (YTD)
2013: 1121
2012: 1135
Property Crimes Reported (YTD)
2013: 7738
2012: 7714
Other Crimes Reported (YTD)
2013: 5017
2012: 5296
Total Crimes Reported (YTD)
2013: 13876
2012: 14145


