

Michael Riley: These RI Cities + Towns Could Be Next in Bankruptcy
Michael G. Riley, GoLocalProv MINDSETTER™
Michael Riley: These RI Cities + Towns Could Be Next in Bankruptcy
In Rhode Island we have a process for distressed cities and through 2010 legislation we have also strengthened the protection of Municipal bondholders. Central Falls went through this process and the result was an overseer, commission and ultimately receivership that resulted in sharp cuts to employee and retiree benefits. Using Central Falls metrics as markers, I have compared their stats just prior to Chapter 9 filings with other current vulnerable cities in Rhode Island and to re-emphasize the point that Rhode Island is much worse than other regions around the country, I have compared some of the most vulnerable and tax burdened towns in Rhode Island to the top 25 Cities in America. Rhode Island municipalities look awful when using very widely used metrics such as Unfunded Actuarial Accrued Liability. UAAL is then measured against payroll, against assets currently in the plan, UAAL per capita and UAAL per household.
GET THE LATEST BREAKING NEWS HERE -- SIGN UP FOR GOLOCAL FREE DAILY EBLAST
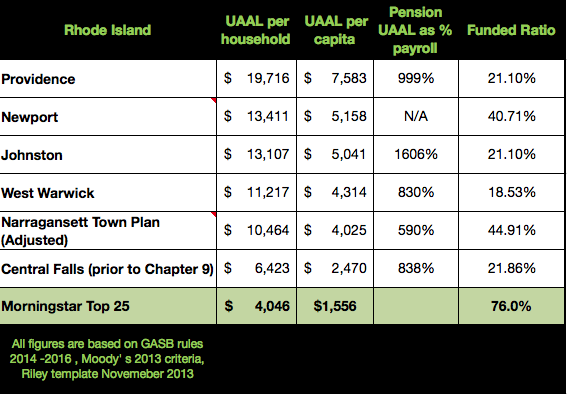
As you can see several RI towns and cities have already passed the point where Central Falls was forced to file for Chapter 9. Measuring household burden shows many RI communities are in serious trouble. Funded ratios are also alarming. This canary in the coal mine, known as Central Falls, has established historic warning levels and if you live in a town on this list you should be asking your town officials what they are doing about it. Far too many officials are still doing nothing because they won’t confront the unions and taxpayers or don’t have any idea what to do. They should be fired.
Ultimately it’s up to the voters. The path of least resistance for elected and appointed officials is still to ignore the problem they have either created or exacerbated. The result will likely be devastating to your personal finances and the town as a whole. Affecting everything from tax rates to municipal services and home values. The time for taxpayers to speak up for change is running out.

Providence Pension Liability

Unfunded Liability in 2013
Total Liability: $1.2 billion
Actuarial Assets: $380.4 million
Unfunded Liability: $831.5 million

Unfunded Liability in 2011
Total Liability: $1.2 billion
Actuarial Assets: $380.4 million
Unfunded Liability: $831.5 million

Percent Funded in 2013
Funding Ratio: The ratio of the amount of actuarial assets to the amount owed.
Funding ratio in 2013: 31.39%
Percent unfunded in 2013: 68.61%

Percent Funded in 2011
Funding Ratio: The ratio of the amount of actuarial assets to the amount owed.
Funding ratio in 2011: 31.94%
Percent unfunded in 2011: 68.06%

Rate of Return
Former Assumed Rate of Return: 8.5%
New Assumed Rate of Return: 8.25%
What the state’s assumed rate of return is: 7.5%
What Moody’s Investors Service says the assumed rate of return should be: 5.5%
What investor Warren Buffet says the assumed rate of return should be: 6%

Actual Return on Investment
Actual Market Return in FY 2012: 1.49%
Actual Market Return in FY 2013: 11.35%
Current Assumed Rate of Return: 6.42%
Average Market Rate of Return for FY 12 and FY 13: 8.25%

Impact of Lower Rates of Return
$72 million:The city unfunded liability increased by this amount when the city lowered its assumed rate of return by a quarter of a percentage point, from 8.5% to 8.25%
$506.2 million: The estimated increase in the unfunded liability were the city to use the 6% assumed rate of return recommended by Moody’s Investors Service.

Retiree Pay – Fire and Police
Number on Active Duty: 834
Average Annual Pay: $61,325
Number of Retirees: 587
Average Retiree Age: 65.3
Average Retiree Annual Pay: $40,512

Disability Pensions – Fire and Police
Number on Disability: 418
Average Age: 64.8
Average Annual Pay: $59,028

Retiree Pay – Other City Workers
Number of City Workers: 2,164
Average Annual Pay: $38,687
Number of Retirees: 1,453
Average Retiree Age: 72
Average Retiree Annual Pay: $18,252

Disability Pensions – Other City Workers
Number on Disability: 88
Average Age: 66.8
Average Annual Pay: $18,684

Current Cost of Pension Fund
For 2013
City Contribution: $58.1 million
Employees Contribution: $10.9 million
Net Investment Return: $18.1 million
Cost of Retiree Benefits: $95.4 million
Note: Net investment return is the return on investments after investment and administrative fees have been paid.

Cost of Pension Fund in 10 Years
Normal Cost: $9.8 million
Additional Cost Because
of Unfunded Liability: $84 million
Total Annual Cost: $94.3 million
Note: Total figure for the year includes a small second payment for the deferred liability.

Cost of Pension Fund in 20 Years
Normal Cost: $13.9 million
Additional Cost Because
of Unfunded Liability: $118.5 million
Total Cost: $132.4 million

Paying Off Unfunded Liability
Average annual increase: 3.5%
Number of additional years to pay off: 27
Fiscal year unfunded liability to be paid off by: 2040


