slides: The Communities with the Greatest Racial Disparities in Traffic Stops
Thursday, October 16, 2014
GoLocalProv News Team
See which local police agencies are more likely to stop a non-white driver.
Related Slideshow: The Communities with the Greatest Racial Disparities in Traffic Stops
The below slides show the racial disparities in traffic stops, ranking communities from least to greatest. For each community, the total number of stops is shown, along with the percentage of non-white drivers compared to the number of non-white drivers who are stopped. A racial disparity appears when the percentage of non-white drivers stopped exceeds the percentage of drivers who are non-white. Data is from a newly released report from the Institute on Race and Justice at Northeastern University. Data was collected by local law enforcement for traffic stops between January 2013 and May 2014. Note: Exeter and Block Island are not included in the report.
 View Larger +
Prev
Next
#37 Barrington
# of Stops: 7,634
% Non-White Stops: 7.8%
% Non-White Driving Population: 14.5%
Disparity: -6.7%
 View Larger +
Prev
Next
#36 West Greenwich
# of Stops: 1,376
% Non-White Stops: 5.2%
% Non-White Driving Population: 8.0%
Disparity: -2.8%
 View Larger +
Prev
Next
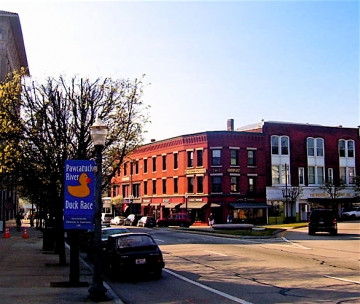
#35 Westerly
# of Stops: 5,304
% Non-White Stops: 8.9%
% Non-White Driving Population: 11.5%
Disparity: -2.6%
 View Larger +
Prev
Next
#34 Central Falls
# of Stops: 3,793
% Non-White Stops: 62.5%
% Non-White Driving Population: 64.8%
Disparity: -2.3%
 View Larger +
Prev
Next
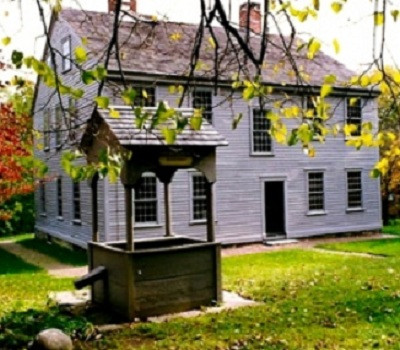
#33 Bristol
# of Stops: 5,439
% Non-White Stops: 7.5%
% Non-White Driving Population: 7.7%
Disparity: -0.2%
 View Larger +
Prev
Next
#32 Coventry
# of Stops: 7,520
% Non-White Stops: 4.8%
% Non-White Driving Population: 5.0%
Disparity: -0.2%
 View Larger +
Prev
Next
#31 North Kingstown
# of Stops: 8,819
% Non-White Stops: 10.1%
% Non-White Driving Population: 10.3%
Disparity: -0.2%
 View Larger +
Prev
Next
#30 Warwick
# of Stops: 20,707
% Non-White Stops: 13.8%
% Non-White Driving Population: 13.9%
Disparity: -0.1%
 View Larger +
Prev
Next
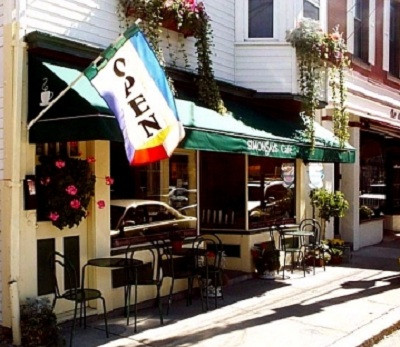
#29 Burrillville
# of Stops: 2,628
% Non-White Stops: 4.6%
% Non-White Driving Population: 4.4%
Disparity: 0.2%
 View Larger +
Prev
Next
#28 East Greenwich
# of Stops: 4,738
% Non-White Stops: 9.9%
% Non-White Driving Population: 9.4%
Disparity: 0.4%
 View Larger +
Prev
Next
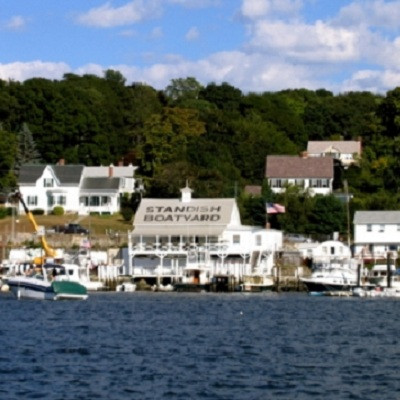
#27 East Providence
# of Stops: 12,612
% Non-White Stops: 19.9%
% Non-White Driving Population: 18.7%
Disparity: 1.2%
 View Larger +
Prev
Next
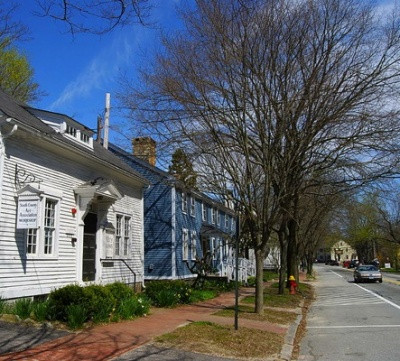
#26 Tiverton
# of Stops: 942
% Non-White Stops: 6.2%
% Non-White Driving Population: 4.9%
Disparity: 1.3%
 View Larger +
Prev
Next
#25 South Kingstown
# of Stops: 9,233
% Non-White Stops: 11.4%
% Non-White Driving Population: 10.0%
Disparity: 1.5%
 View Larger +
Prev
Next
#24 Little Compton
# of Stops: 1,967
% Non-White Stops: 4.5%
% Non-White Driving Population: 2.8%
Disparity: 1.7%
 View Larger +
Prev
Next
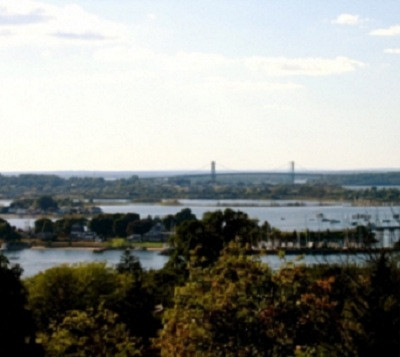
#23 Richmond
# of Stops: 1,418
% Non-White Stops: 6.6%
% Non-White Driving Population: 4.7%
Disparity: 2.0%
 View Larger +
Prev
Next
#22 Portsmouth
# of Stops: 9,347
% Non-White Stops: 10.1%
% Non-White Driving Population: 7.9%
Disparity: 2.2%
 View Larger +
Prev
Next
#19 Charlestown
# of Stops: 2,518
% Non-White Stops: 7.6%
% Non-White Driving Population: 5.0%
Disparity: 2.6%
 View Larger +
Prev
Next
#20 Narragansett
# of Stops: 5,151
% Non-White Stops: 7.5%
% Non-White Driving Population: 4.9%
Disparity: 2.7%
 View Larger +
Prev
Next
#19 Newport
# of Stops: 6,266
% Non-White Stops: 17.5%
% Non-White Driving Population: 14.5%
Disparity: 3.0%
 View Larger +
Prev
Next
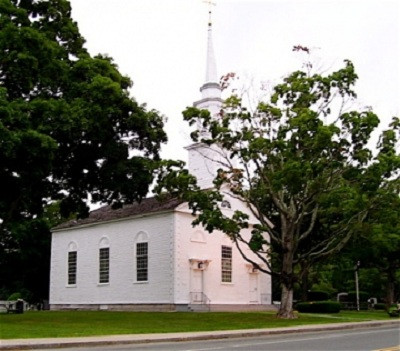
#18 Glocester
# of Stops: 3,897
% Non-White Stops: 7.1%
% Non-White Driving Population: 3.9%
Disparity: 3.1%
 View Larger +
Prev
Next
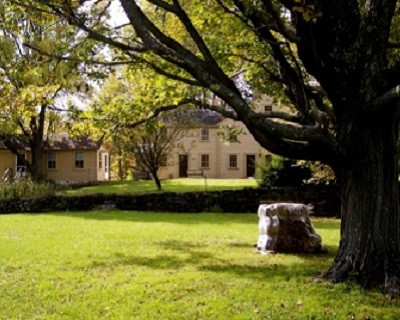
#17 Scituate
# of Stops: 2,376
% Non-White Stops: 7.4%
% Non-White Driving Population: 4.1%
Disparity: 3.3%
 View Larger +
Prev
Next
#16 Smithfield
# of Stops: 6,848
% Non-White Stops: 11.2%
% Non-White Driving Population: 7.8%
Disparity: 3.4%
 View Larger +
Prev
Next
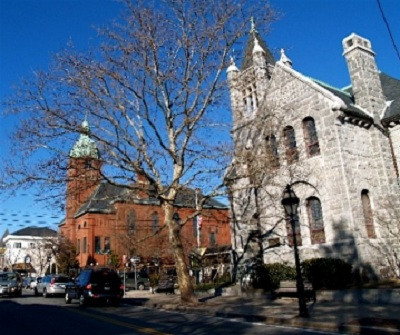
#15 Jamestown
# of Stops: 3,286
% Non-White Stops: 8.0%
% Non-White Driving Population: 4.4%
Disparity: 3.6%
 View Larger +
Prev
Next
#14 Warren
# of Stops: 2,308
% Non-White Stops: 10.0%
% Non-White Driving Population: 5.5%
Disparity: 4.5%
 View Larger +
Prev
Next
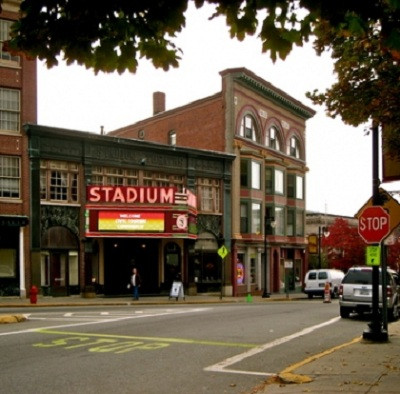
#13 Middletown
# of Stops: 8,008
% Non-White Stops: 18.1%
% Non-White Driving Population: 12.4%
Disparity: 5.6%
 View Larger +
Prev
Next
#12 Woonsocket
# of Stops: 4,863
% Non-White Stops: 27.5%
% Non-White Driving Population: 21.6%
Disparity: 5.9%
 View Larger +
Prev
Next
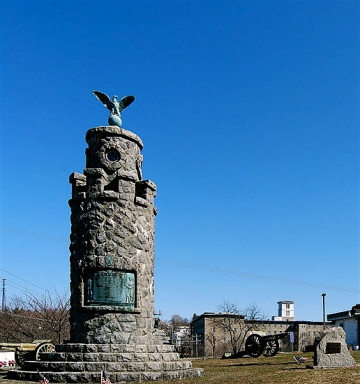
#11 Hopkinton
# of Stops: 5,217
% Non-White Stops: 11.4%
% Non-White Driving Population: 5.5%
Disparity: 5.9%
 View Larger +
Prev
Next
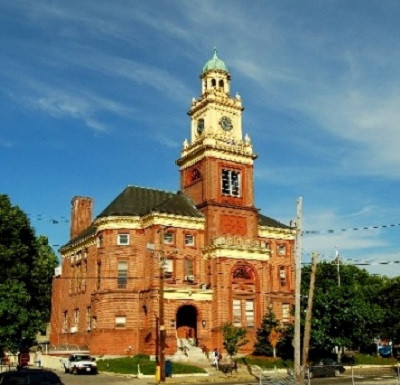
#10 West Warwick
# of Stops: 8,954
% Non-White Stops: 10.6%
% Non-White Driving Population: 4.6%
Disparity: 6.0%
 View Larger +
Prev
Next
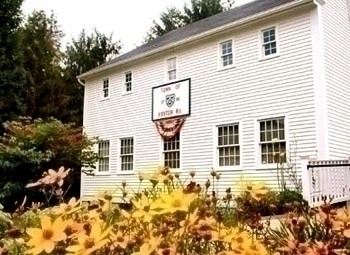
#9 Cumberland
# of Stops: 5,314
% Non-White Stops: 16.9%
% Non-White Driving Population: 10.6%
Disparity: 6.3%
 View Larger +
Prev
Next
#8 Foster
# of Stops: 2,323
% Non-White Stops: 12.7%
% Non-White Driving Population: 4.7%
Disparity: 8.0%
 View Larger +
Prev
Next
#7 Pawtucket
# of Stops: 17,779
% Non-White Stops: 42.8%
% Non-White Driving Population: 34.5%
Disparity: 8.3%
 View Larger +
Prev
Next
#6 Johnston
# of Stops: 8,374
% Non-White Stops: 24.9%
% Non-White Driving Population: 11.9%
Disparity: 12.9%
 View Larger +
Prev
Next
#5 Lincoln
# of Stops: 2,197
% Non-White Stops: 24.9%
% Non-White Driving Population: 11.4%
Disparity: 13.6%
 View Larger +
Prev
Next
#4 North Providence
# of Stops: 5,305
% Non-White Stops: 32.0%
% Non-White Driving Population: 16.2%
Disparity: 15.8%
 View Larger +
Prev
Next
#3 Cranston
# of Stops: 12,875
% Non-White Stops: 38.6%
% Non-White Driving Population: 21.4%
Disparity: 17.1%
 View Larger +
Prev
Next
#2 North Smithfield
# of Stops: 3,120
% Non-White Stops: 27.1%
% Non-White Driving Population: 5.5%
Disparity: 21.7%
 View Larger +
Prev
Next
#1 Providence
# of Stops: 18,026
% Non-White Stops: 64.0%
% Non-White Driving Population: 39.9%
Disparity: 24.1%
Enjoy this post? Share it with others.


