NEW: RI’s Homeless Population Shrinks for First Time Since 2007
Wednesday, February 26, 2014
GoLocalProv News Team
Rhode Island’s homeless population is on the decline for the first time since 2007, according to new report released by the
Rhode Island Coalition for the Homeless today. The 2013 data shows that the number of homeless individuals decreased from 4,868 in 2012 to 4,447 in 2013, which is a 9% dip. The figures also showed decreases from 2012 to 2013 for children, families and veterans entering homelessness.
Reason for the decline
Providence College Professor Dr. Eric Hirsch, who released the statistics, attributed the decrease to a combination of a recovering economy and the homeless system beginning to see the benefits of programs outlined in Opening Doors Rhode Island, the state’s plan to end homelessness.
“In addition to creating better outcomes for those Rhode Islanders experiencing homelessness, housing our homeless makes good, sound fiscal sense,” explained Hirsch. “My research shows a cost savings of $10,000 for the typical Medicaid user who was homeless, once they become stabilized with housing.”
GET THE LATEST BREAKING NEWS HERE -- SIGN UP FOR GOLOCAL FREE DAILY EBLAST
The encouraging news was announced this morning at a State House event, which included advocates, homeless and formerly homeless constituents. The event also included the launch of State House Project Homeless Connect, a special event that will weekly directly link the homeless to the services they need.
The data
The Annual Statistics also found decreases across the board including:
-
9% decrease in the overall number of homeless from 4,868 in 2012 to 4,447 in 2013
-
7% decrease in homeless families from 678 in 2012 to 631 in 2013
-
13% decrease in homeless children from 1,277 in 2012 to 1,117 in 2013
-
12% decrease for homeless veterans from 299 in 2012 to 264 in 2013
Looking forward
There was one area of concern amongst the positive news, the fact that the most chronic, long-term individuals are staying longer in the shelters. But even that news has a silver lining. With the recent funding of $750,000 for rental vouchers by the Legislature, 125 of the most chronic homeless are in the process of being housed.
“We are thrilled to see positive movement towards our vision of a state that houses its citizens that have experienced homelessness, rather than simply sheltering them,” said Jim Ryczek, Executive Director of the Rhode Island Coalition for the Homeless. “We have long known how to end homelessness in our state, but we have needed the funding to make it a reality. This legislative session can build on last year’s funding success by supporting legislation that continues to fund the solutions.”
“Homelessness exacerbates health problems and difficulties with accessing appropriate overall healthcare,” added Vickie Walters, Associate Director of Residential and Home Base for the Providence Center, one of the agencies that received the new rental voucher funding to house the homeless. “Housing has improved the quality of life for many formerly chronic homeless Rhode Islanders. Housing is an essential innovation. Housing with appropriate services provides stability and the base for improving overall health. It enables folks to become positive, active participants in the world and enables people to reconnect with their family. Housing is healthcare.”
Click here to read more about the report.
Related Slideshow: Rhode Island’s Most Unemployed Cities and Towns
Below are the unemployment rates for Rhode Island's 39 cities and towns from August 2013.
The statewide average for the month was 9.1% -- the third highest rate in the country.
 View Larger +
Prev
Next
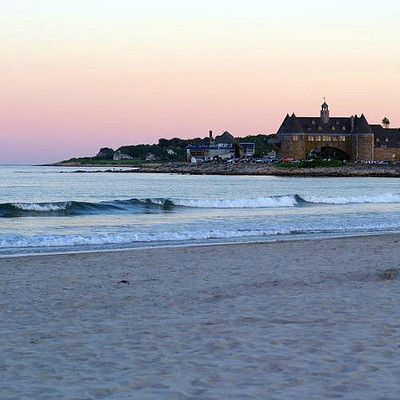
#39 Narragansett
Latest Unemployment Rate: 6.0
Labor Force: 9,244
Employed: 8,688
Highest Rate in Last Two Years: 9.0 (January 2012)
Lowest Rate in Last Two Years: 5.6 (September 2012, June 2013)
View Larger +
Prev
Next
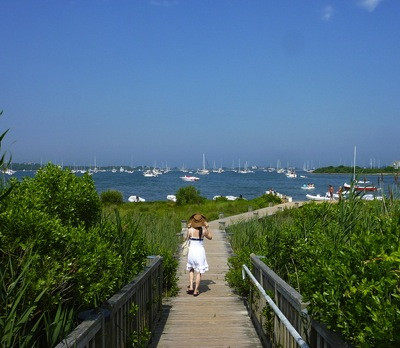
#37 (Tie) Jamestown
Latest Unemployment Rate: 6.5
Labor Force: 3,014
Employed: 2,818
Highest Rate in Last Two Years: 9.5 (February 2012)
Lowest Rate in Last Two Years: 5.7 (June 2013)
 View Larger +
Prev
Next
#37 (Tie) New Shoreham
Latest Unemployment Rate: 6.5
Labor Force: 1,507
Employed: 1,409
Highest Rate in Last Two Years: 30.9 (February 2012)
Lowest Rate in Last Two Years: 5.0 (August 2011)
View Larger +
Prev
Next
#36 Barrington
Latest Unemployment Rate: 6.8
Labor Force: 8,211
Employed: 7,651
Highest Rate in Last Two Years: 8.8 (August 2011)
Lowest Rate in Last Two Years: 6.4 (April, May, July 2013)
 View Larger +
Prev
Next
#35 Richmond
Latest Unemployment Rate: 6.9
Labor Force: 4,316
Employed: 4,018
Highest Rate in Last Two Years: 8.5 (February 2012)
Lowest Rate in Last Two Years: 5.2 (May 2013)
 View Larger +
Prev
Next
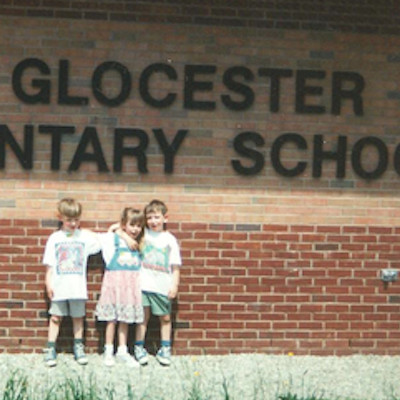
#34 Glocester
Latest Unemployment Rate: 7.2
Labor Force: 5,893
Employed: 5,470
Highest Rate in Last Two Years: 10.7 (February 2012)
Lowest Rate in Last Two Years: 6.4 (June 2013)
View Larger +
Prev
Next
#33 North Kingstown
Latest Unemployment Rate: 7.3
Labor Force: 15,033
Employed: 13,939
Highest Rate in Last Two Years: 10.5 (January, February 2012)
Lowest Rate in Last Two Years: 6.6 (June 2013)
View Larger +
Prev
Next
#32 Little Compton
Latest Unemployment Rate: 7.4
Labor Force: 1,904
Employed: 1,763
Highest Rate in Last Two Years: 12.4 (January 2012)
Lowest Rate in Last Two Years: 6.9 (April 2013)
View Larger +
Prev
Next
#31 Middletown
Latest Unemployment Rate: 7.5
Labor Force: 7,917
Employed: 7,325
Highest Rate in Last Two Years: 13.5 (January 2012)
Lowest Rate in Last Two Years: 7.1 (June 2013)
View Larger +
Prev
Next
#30 Portsmouth
Latest Unemployment Rate: 7.6
Labor Force: 9,362
Employed: 8,651
Highest Rate in Last Two Years: 11.5 (January 2012)
Lowest Rate in Last Two Years: 6.6 (June 2013)
View Larger +
Prev
Next
#28 (Tie) Bristol
Latest Unemployment Rate: 8.0
Labor Force: 12,455
Employed: 11,457
Highest Rate in Last Two Years: 10.6 (January 2012)
Lowest Rate in Last Two Years: 6.6 (June 2013)
View Larger +
Prev
Next
#28 (Tie) Westerly
Latest Unemployment Rate: 8.0
Labor Force: 11,917
Employed: 10,961
Highest Rate in Last Two Years: 11.2 (February 2012)
Lowest Rate in Last Two Years: 6.8 (September 2012)
View Larger +
Prev
Next
#27 Smithfield
Latest Unemployment Rate: 8.3
Labor Force: 11,781
Employed: 10,799
Highest Rate in Last Two Years: 10.4 (August 2011, February 2012)
Lowest Rate in Last Two Years: 5.7 (June 2013)
View Larger +
Prev
Next
#25 (Tie) Foster
Latest Unemployment Rate: 8.4
Labor Force: 2,701
Employed: 2,475
Highest Rate in Last Two Years: 13.4 (February 2012)
Lowest Rate in Last Two Years: 7.9 (June 2012)
View Larger +
Prev
Next
#25 (Tie) N. Smithfield
Latest Unemployment Rate: 8.4
Labor Force: 3,014
Employed: 2,818
Highest Rate in Last Two Years: 9.8 (August 2012)
Lowest Rate in Last Two Years: 7.4 (December 2012)
View Larger +
Prev
Next
#23 (Tie) Coventry
Latest Unemployment Rate: 8.6
Labor Force: 20,279
Employed: 18,537
Highest Rate in Last Two Years: 11.1 (August 2011, February 2012)
Lowest Rate in Last Two Years: 7.1 (June 2013)
View Larger +
Prev
Next
#23 (Tie) Cumberland
Latest Unemployment Rate: 8.6
Labor Force: 19,055
Employed: 17,422
Highest Rate in Last Two Years: 10.4 (August 2011, July 2012)
Lowest Rate in Last Two Years: 7.4 (June 2013)
View Larger +
Prev
Next
#20 (Tie) Newport
Latest Unemployment Rate: 8.7
Labor Force: 12,885
Employed: 11,763
Highest Rate in Last Two Years: 14.1 (January 2012)
Lowest Rate in Last Two Years: 7.2 (September 2012)
View Larger +
Prev
Next
#20 (Tie) Warwick
Latest Unemployment Rate: 8.7
Labor Force: 46,308
Employed: 42,297
Highest Rate in Last Two Years: 9.5 (February 2012)
Lowest Rate in Last Two Years: 10.4 (August 2011)
View Larger +
Prev
Next
#20 (Tie) West Greenwich
Latest Unemployment Rate: 8.7
Labor Force: 3,678
Employed: 3,359
Highest Rate in Last Two Years: 11.7 (February 2012)
Lowest Rate in Last Two Years: 6.6 (June 2013)
View Larger +
Prev
Next
#19 East Greenwich
Latest Unemployment Rate: 8.9
Labor Force: 6,784
Employed: 6,178
Highest Rate in Last Two Years: 11.0 (February 2012)
Lowest Rate in Last Two Years: 7.5 (June 2013)
View Larger +
Prev
Next
#15 (Tie) Charlestown
Latest Unemployment Rate: 9.0
Labor Force: 4,506
Employed: 4,099
Highest Rate in Last Two Years: 14.2 (January 2012)
Lowest Rate in Last Two Years: 7.1 (June 2013)
View Larger +
Prev
Next
#15 (Tie) Lincoln
Latest Unemployment Rate: 9.0
Labor Force: 11,781
Employed: 10,717
Highest Rate in Last Two Years: 10.4 (February 2012)
Lowest Rate in Last Two Years: 7.9 (November 2012, June 2013)
View Larger +
Prev
Next
#15 (Tie) South Kingstown
Latest Unemployment Rate: 9.0
Labor Force: 16,455
Employed: 14,982
Highest Rate in Last Two Years: 10.6 (January 2012)
Lowest Rate in Last Two Years: 7.8 (September 2012)
View Larger +
Prev
Next
#15 (Tie) Warren
Latest Unemployment Rate: 9.0
Labor Force: 5,908
Employed: 5,377
Highest Rate in Last Two Years: 12.0 (February 2012)
Lowest Rate in Last Two Years: 7.6 (June 2013)
View Larger +
Prev
Next
#14 Exeter
Latest Unemployment Rate: 9.2
Labor Force: 3,865
Employed: 3,509
Highest Rate in Last Two Years: 11.7 (March 2012)
Lowest Rate in Last Two Years: 7.6 (September 2011)
View Larger +
Prev
Next
#13 Tiverton
Latest Unemployment Rate: 9.3
Labor Force: 8,882
Employed: 8,058
Highest Rate in Last Two Years: 12.0 (January, February 2012)
Lowest Rate in Last Two Years: 7.4 (June 2013)
View Larger +
Prev
Next
#10 (Tie) Cranston
Latest Unemployment Rate: 9.5
Labor Force: 41,657
Employed: 37,682
Highest Rate in Last Two Years: 11.3 (July 2012)
Lowest Rate in Last Two Years: 8.8 (April 2013)
View Larger +
Prev
Next
#10 (Tie) East Providence
Latest Unemployment Rate: 9.5
Labor Force: 24,677
Employed: 22,339
Highest Rate in Last Two Years: 12.6 (January, February 2012)
Lowest Rate in Last Two Years: 8.7 (June 2013)
View Larger +
Prev
Next
#10 (Tie) West Warwick
Latest Unemployment Rate: 9.5
Labor Force: 16,240
Employed: 14,693
Highest Rate in Last Two Years: 12.9 (February 2012)
Lowest Rate in Last Two Years: 8.4 (June 2013)
View Larger +
Prev
Next
#8 (Tie) Hopkinton
Latest Unemployment Rate: 9.8
Labor Force: 4,888
Employed: 4,411
Highest Rate in Last Two Years: 11.2 (February 2012)
Lowest Rate in Last Two Years: 6.6 (June 2012)
View Larger +
Prev
Next
#8 (Tie) North Providence
Latest Unemployment Rate: 9.8
Labor Force: 18,130
Employed: 16,347
Highest Rate in Last Two Years: 11.3 (August 2011)
Lowest Rate in Last Two Years: 8.5 (April 2013)
View Larger +
Prev
Next
#7 Burrillville
Latest Unemployment Rate: 10.0
Labor Force: 9,526
Employed: 8,570
Highest Rate in Last Two Years: 11.6 (February 2012)
Lowest Rate in Last Two Years: 8.0 (June 2013)
View Larger +
Prev
Next
#6 Scituate
Latest Unemployment Rate: 10.4
Labor Force: 6,166
Employed: 5,527
Highest Rate in Last Two Years: 11.2 (July 2012)
Lowest Rate in Last Two Years: 8.4 (June 2013)
View Larger +
Prev
Next
#5 Johnston
Latest Unemployment Rate: 10.5
Labor Force: 15,645
Employed: 14,004
Highest Rate in Last Two Years: 12.9 (February 2012)
Lowest Rate in Last Two Years: 9.2 (June 2013)
View Larger +
Prev
Next
#4 Pawtucket
Latest Unemployment Rate: 11.1
Labor Force: 36,412
Employed: 32,378
Highest Rate in Last Two Years: 13.7 (July 2012)
Lowest Rate in Last Two Years: 10.2 (June 2013)
View Larger +
Prev
Next
#3 Woonsocket
Latest Unemployment Rate: 11.2
Labor Force: 20,730
Employed: 18,409
Highest Rate in Last Two Years: 13.6 (January 2012)
Lowest Rate in Last Two Years: 10.7 (June 2013)
View Larger +
Prev
Next
#2 Providence
Latest Unemployment Rate: 11.5
Labor Force: 80,605
Employed: 71,362
Highest Rate in Last Two Years: 14.3 (August 2011)
Lowest Rate in Last Two Years: 10.4 (May 2013)
View Larger +
Prev
Next
#1 Central Falls
Latest Unemployment Rate: 12.1
Labor Force: 8,348
Employed: 7,341
Highest Rate in Last Two Years: 15.3 (January, February 2012)
Lowest Rate in Last Two Years: 11.4 (April 2013)
Related Articles
Enjoy this post? Share it with others.


