
NEW: Central Landfill Sued for Clean Air Act Violations
Monday, December 16, 2013
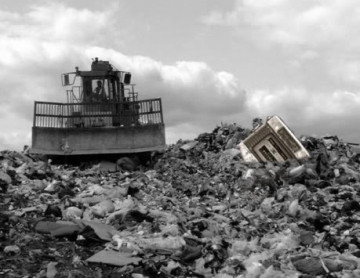
A citizen suit has been filed in federal court by the Conservation Law Foundation (CLF), against the owners and operators of the Central Landfill in Johnston for violating the Clean Air Act, by allowing polluted landfill gas to escape into the air.
The lawsuit alleges that Rhode Island LFG Genco, LLC, Broadrock Gas Services, LLC, and Rhode Island Resource Recovery Corporation (RIRRC) have failed to adequately collect gas, have failed to operate gas combustion equipment properly, have violated conditions in existing permits, and have failed to obtain a required operating permit.
As waste breaks down in the Landfill, it produces landfill gas. Landfill gas contains hydrogen sulfide (a toxic air pollutant), volatile organic compounds (a family of gases that includes toxic and hazardous pollutants like benzene and toluene) and methane (a powerful greenhouse gas).
GET THE LATEST BREAKING NEWS HERE -- SIGN UP FOR GOLOCAL FREE DAILY EBLAST“We have toxic air pollution escaping from the Landfill. It can and should be captured and destroyed," said Tricia K. Jedele, Vice President and Director of CLF’s Rhode Island office. "That isn’t happening and all of these parties are responsible for that failure.”
The lawsuit claims that the owners and operators are not collecting enough landfill gas, and the gas is escaping through the ground without being collected. Jedele said, “Very simply, the gas collection system at the Central Landfill is broken. Among other things, the collection wells are flooded or obstructed.”
CLF also claims that the owners and operators of the landfill illegally burned untreated landfill gas resulting in an increase of sulfur dioxide emissions (which causes respiratory-system damage) and that some of the control equipment used to destroy pollutants in the gas is not being operated properly, resulting in excess emissions of Volatile Organic Compounds (VOCs).
“The flares are receiving too much landfill gas and burning it at temperatures too low to destroy the VOCs, so these harmful pollutants are entering the air instead,” said Max Greene, staff attorney in CLF’s Rhode Island office.
Between January 1, 2013 and June 30, 2013, methane gas readings at the Central Landfill violated their legal limit 154 times (sometimes multiple times in the same location), Methane is measured as an indicator for the presence of other air pollutants.
The 37-page complaint was filed in federal district court in Providence, Rhode Island. The listed Defendants have 30 to 60 days to answer the allegations or file dispositive motions.
“CLF’s ultimate goal is to find meaningful and lasting solutions for a significant problem that poses a real threat to public health,” Jedele said.
Related Slideshow: Providence’s Most Dangerous Neighborhoods
Each week, the Providence Police Department releases its "Weekly Crime Comparison Report" on its website. The breakdown covers how many crimes have occured in the past week, past month, and year to date in each Police District and comparing them with the same time interval from the year prior, reflecting changes in crime rates. GoLocal has distilled the key data points from this weeks report to reflect YTD crime data grouped by general category- violent, property, other, and total. We ranked the districts by 2013 violent crimes to date. For the full report as filed by the PPD, click here.
Related Articles
- New Revelations in Landfill Corruption Case
- NEW: DEM Installs Equipment to Monitor Landfill Odor
- Cutting Down at the Landfill: New Products Targeted
- AG Candidate Tied to Tainted Builder at Landfill
- Landfill Investigation: Legal Experts Weigh In
- Landfill Investigation: Cost of Employee ‘Theft’ as High as $24M
- Landfill Investigation: State Sues Developer Over ‘$20 Million Blunder’
- Something Rotten in Landfill Deal?
- NEW: Commission Formed to Investigate Landfill
- NEW: Sen. Tassoni Wants Johnston Landfill Odor Addressed
- Landfill Investigation: Former AG Arlene Violet Rips Lynch for Not Pressing Charges
- GoLocalProv Investigation: New Scandal at State Landfill
- Landfill: State Sues Three Firms
