Lardaro Report: Rhode Island’s Economy Continues to Flounder
Monday, August 11, 2014
GoLocalProv Business Team
In his most recent report, URI Economist Len Lardaro presents a floundering view of economic factors.
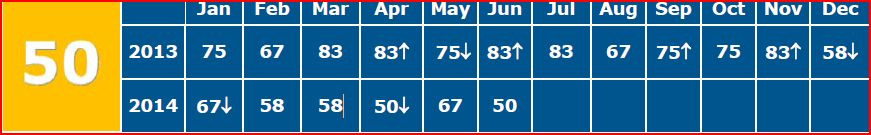
Lardaro states, "Just when it appeared that Rhode Island’s economy was beginning to re-accelerate, bringing back memories of late 2012, along comes June’s data that abruptly shatters that notion and then some. The June Current Conditions Index value fell all the way back to its neutral value of 50, as only six of the twelve CCI indicators improved. Worse yet, April’s value that had been 58 has been revised down to 50 as well. Not exactly life in the fast lane!"
"To say that Rhode Island’s overall performance in 2014 has been somewhat disappointing has now become an understatement. Not only did we never get the post-winter bounce we were hoping for, even the good-weather months are proving to be very disappointing. What I find perplexing about Rhode Island’s most
recent performance is that in spite of an improving national economy, we continue to flounder," said Lardaro.
GET THE LATEST BREAKING NEWS HERE -- SIGN UP FOR GOLOCAL FREE DAILY EBLAST
Lardaro's Current Conditions Index:
Perhaps the most pressing issue now is whether Rhode Island has begun to decouple from the accelerating national economy. Apparently, Rhode Island’s negatives are finally catching up to its positives, increasingly diminishing overall momentum. This is part of the reason why Rhode Island has been unable to reduce its Unemployment Rate to a level that would end its prolonged stretch as the state with the highest jobless rate. Think about this for a moment - not only does Rhode Island lag in terms of its relative performance, if recent trends continue, it will begin to lag in terms of its absolute performance as well. I now characterize Rhode Island’s performance as moving from precarious to tenuous, with June marking the eleventh consecutive month where the CCI has failed to beat its year-earlier value.
For June, only two of the five leading indicators contained within the Current Conditions Index improved, although both did so at healthy rates. Single-Unit Permits, which reflect new home construction, turned in yet another strong performance in June, rising by 23.7 percent relative to last June. Total Manufacturing Hours, which measures strength in our manufacturing sector, rose sharply again in June (+4.3%), as both the length of the workweek rose and manufacturing employment increased. Oddly, in spite of this continuing manufacturing momentum, the Manufacturing Wage actually declined for a fourth consecutive time in June, by 2.3 percent.
US Consumer Sentiment fell for the second consecutive month (-1.6%) following a string of five consecutive increases. Employment Service Jobs, which includes temporary employment, and is a prerequisite to employment growth, declined sharply in June, by 4.1 percent, its seventh consecutive decline. I continue to view changes in this indicator somewhat suspiciously. The biggest surprises for June, which contributed a great deal to the CCI’s neutral value of 50, were increases in both New Claims for Unemployment Insurance, the timeliest measure of layoffs, and Benefit Exhaustions, which reflects longer -term unemployment. Of these, New Claims, which is a leading indicator, rose at an alarming rate, 21.8 percent relative to last June. It is not clear whether the recent improvements in this indicator will prove to be sustainable. Benefit Exhaustions increased by 10 percent relative to a year ago, following two consecutive months of double-digit improvement.
Retail Sales was one of the few bright spots for June, risingby 3.4 percent compared to a year ago. This indicator has now improved for six of the last eight months. Private Service- Producing Employment rose by 1.2 percent in June, slightly slower than its May growth. Government Employment fell once again, declining by 0.3 percent versus last June. Finally, Rhode Island’s Labor Force actually rose again June, while our Unemployment Rate fell to 7.9, but remained #1.
If Rhode Island’s economic momentum is hanging on by a finger nail, apparently that finger nail is its goods-producing sector. Who would have ever though that our state’s goods-producing sector (housing and manufacturing) would be carrying us at a point in time when we
have been a post-manufacturing economy for so long (since late 1987)? While I am hoping that the recent 50 values prove to be aberrations, the best indication of our future direction will be determined by our ability to exceed year-earlier CCI values. Since our elected officials have done virtually nothing to reinvent our state’s economy, all we can do for now is keep our fingers crossed.
Related Slideshow: Rhode Island’s Most Unemployed Cities and Towns
Below are the unemployment rates for Rhode Island's 39 cities and towns from August 2013.
The statewide average for the month was 9.1% -- the third highest rate in the country.
 View Larger +
Prev
Next
#39 Narragansett
Latest Unemployment Rate: 6.0
Labor Force: 9,244
Employed: 8,688
Highest Rate in Last Two Years: 9.0 (January 2012)
Lowest Rate in Last Two Years: 5.6 (September 2012, June 2013)
View Larger +
Prev
Next
#37 (Tie) Jamestown
Latest Unemployment Rate: 6.5
Labor Force: 3,014
Employed: 2,818
Highest Rate in Last Two Years: 9.5 (February 2012)
Lowest Rate in Last Two Years: 5.7 (June 2013)
 View Larger +
Prev
Next
#37 (Tie) New Shoreham
Latest Unemployment Rate: 6.5
Labor Force: 1,507
Employed: 1,409
Highest Rate in Last Two Years: 30.9 (February 2012)
Lowest Rate in Last Two Years: 5.0 (August 2011)
View Larger +
Prev
Next
#36 Barrington
Latest Unemployment Rate: 6.8
Labor Force: 8,211
Employed: 7,651
Highest Rate in Last Two Years: 8.8 (August 2011)
Lowest Rate in Last Two Years: 6.4 (April, May, July 2013)
 View Larger +
Prev
Next
#35 Richmond
Latest Unemployment Rate: 6.9
Labor Force: 4,316
Employed: 4,018
Highest Rate in Last Two Years: 8.5 (February 2012)
Lowest Rate in Last Two Years: 5.2 (May 2013)
 View Larger +
Prev
Next
#34 Glocester
Latest Unemployment Rate: 7.2
Labor Force: 5,893
Employed: 5,470
Highest Rate in Last Two Years: 10.7 (February 2012)
Lowest Rate in Last Two Years: 6.4 (June 2013)
View Larger +
Prev
Next
#33 North Kingstown
Latest Unemployment Rate: 7.3
Labor Force: 15,033
Employed: 13,939
Highest Rate in Last Two Years: 10.5 (January, February 2012)
Lowest Rate in Last Two Years: 6.6 (June 2013)
View Larger +
Prev
Next
#32 Little Compton
Latest Unemployment Rate: 7.4
Labor Force: 1,904
Employed: 1,763
Highest Rate in Last Two Years: 12.4 (January 2012)
Lowest Rate in Last Two Years: 6.9 (April 2013)
View Larger +
Prev
Next
#31 Middletown
Latest Unemployment Rate: 7.5
Labor Force: 7,917
Employed: 7,325
Highest Rate in Last Two Years: 13.5 (January 2012)
Lowest Rate in Last Two Years: 7.1 (June 2013)
View Larger +
Prev
Next
#30 Portsmouth
Latest Unemployment Rate: 7.6
Labor Force: 9,362
Employed: 8,651
Highest Rate in Last Two Years: 11.5 (January 2012)
Lowest Rate in Last Two Years: 6.6 (June 2013)
View Larger +
Prev
Next
#28 (Tie) Bristol
Latest Unemployment Rate: 8.0
Labor Force: 12,455
Employed: 11,457
Highest Rate in Last Two Years: 10.6 (January 2012)
Lowest Rate in Last Two Years: 6.6 (June 2013)
View Larger +
Prev
Next
#28 (Tie) Westerly
Latest Unemployment Rate: 8.0
Labor Force: 11,917
Employed: 10,961
Highest Rate in Last Two Years: 11.2 (February 2012)
Lowest Rate in Last Two Years: 6.8 (September 2012)
View Larger +
Prev
Next
#27 Smithfield
Latest Unemployment Rate: 8.3
Labor Force: 11,781
Employed: 10,799
Highest Rate in Last Two Years: 10.4 (August 2011, February 2012)
Lowest Rate in Last Two Years: 5.7 (June 2013)
View Larger +
Prev
Next
#25 (Tie) Foster
Latest Unemployment Rate: 8.4
Labor Force: 2,701
Employed: 2,475
Highest Rate in Last Two Years: 13.4 (February 2012)
Lowest Rate in Last Two Years: 7.9 (June 2012)
View Larger +
Prev
Next
#25 (Tie) N. Smithfield
Latest Unemployment Rate: 8.4
Labor Force: 3,014
Employed: 2,818
Highest Rate in Last Two Years: 9.8 (August 2012)
Lowest Rate in Last Two Years: 7.4 (December 2012)
View Larger +
Prev
Next
#23 (Tie) Coventry
Latest Unemployment Rate: 8.6
Labor Force: 20,279
Employed: 18,537
Highest Rate in Last Two Years: 11.1 (August 2011, February 2012)
Lowest Rate in Last Two Years: 7.1 (June 2013)
View Larger +
Prev
Next
#23 (Tie) Cumberland
Latest Unemployment Rate: 8.6
Labor Force: 19,055
Employed: 17,422
Highest Rate in Last Two Years: 10.4 (August 2011, July 2012)
Lowest Rate in Last Two Years: 7.4 (June 2013)
View Larger +
Prev
Next
#20 (Tie) Newport
Latest Unemployment Rate: 8.7
Labor Force: 12,885
Employed: 11,763
Highest Rate in Last Two Years: 14.1 (January 2012)
Lowest Rate in Last Two Years: 7.2 (September 2012)
View Larger +
Prev
Next
#20 (Tie) Warwick
Latest Unemployment Rate: 8.7
Labor Force: 46,308
Employed: 42,297
Highest Rate in Last Two Years: 9.5 (February 2012)
Lowest Rate in Last Two Years: 10.4 (August 2011)
View Larger +
Prev
Next
#20 (Tie) West Greenwich
Latest Unemployment Rate: 8.7
Labor Force: 3,678
Employed: 3,359
Highest Rate in Last Two Years: 11.7 (February 2012)
Lowest Rate in Last Two Years: 6.6 (June 2013)
View Larger +
Prev
Next
#19 East Greenwich
Latest Unemployment Rate: 8.9
Labor Force: 6,784
Employed: 6,178
Highest Rate in Last Two Years: 11.0 (February 2012)
Lowest Rate in Last Two Years: 7.5 (June 2013)
View Larger +
Prev
Next
#15 (Tie) Charlestown
Latest Unemployment Rate: 9.0
Labor Force: 4,506
Employed: 4,099
Highest Rate in Last Two Years: 14.2 (January 2012)
Lowest Rate in Last Two Years: 7.1 (June 2013)
View Larger +
Prev
Next
#15 (Tie) Lincoln
Latest Unemployment Rate: 9.0
Labor Force: 11,781
Employed: 10,717
Highest Rate in Last Two Years: 10.4 (February 2012)
Lowest Rate in Last Two Years: 7.9 (November 2012, June 2013)
View Larger +
Prev
Next
#15 (Tie) South Kingstown
Latest Unemployment Rate: 9.0
Labor Force: 16,455
Employed: 14,982
Highest Rate in Last Two Years: 10.6 (January 2012)
Lowest Rate in Last Two Years: 7.8 (September 2012)
View Larger +
Prev
Next
#15 (Tie) Warren
Latest Unemployment Rate: 9.0
Labor Force: 5,908
Employed: 5,377
Highest Rate in Last Two Years: 12.0 (February 2012)
Lowest Rate in Last Two Years: 7.6 (June 2013)
View Larger +
Prev
Next
#14 Exeter
Latest Unemployment Rate: 9.2
Labor Force: 3,865
Employed: 3,509
Highest Rate in Last Two Years: 11.7 (March 2012)
Lowest Rate in Last Two Years: 7.6 (September 2011)
View Larger +
Prev
Next
#13 Tiverton
Latest Unemployment Rate: 9.3
Labor Force: 8,882
Employed: 8,058
Highest Rate in Last Two Years: 12.0 (January, February 2012)
Lowest Rate in Last Two Years: 7.4 (June 2013)
View Larger +
Prev
Next
#10 (Tie) Cranston
Latest Unemployment Rate: 9.5
Labor Force: 41,657
Employed: 37,682
Highest Rate in Last Two Years: 11.3 (July 2012)
Lowest Rate in Last Two Years: 8.8 (April 2013)
View Larger +
Prev
Next
#10 (Tie) East Providence
Latest Unemployment Rate: 9.5
Labor Force: 24,677
Employed: 22,339
Highest Rate in Last Two Years: 12.6 (January, February 2012)
Lowest Rate in Last Two Years: 8.7 (June 2013)
View Larger +
Prev
Next
#10 (Tie) West Warwick
Latest Unemployment Rate: 9.5
Labor Force: 16,240
Employed: 14,693
Highest Rate in Last Two Years: 12.9 (February 2012)
Lowest Rate in Last Two Years: 8.4 (June 2013)
View Larger +
Prev
Next
#8 (Tie) Hopkinton
Latest Unemployment Rate: 9.8
Labor Force: 4,888
Employed: 4,411
Highest Rate in Last Two Years: 11.2 (February 2012)
Lowest Rate in Last Two Years: 6.6 (June 2012)
View Larger +
Prev
Next
#8 (Tie) North Providence
Latest Unemployment Rate: 9.8
Labor Force: 18,130
Employed: 16,347
Highest Rate in Last Two Years: 11.3 (August 2011)
Lowest Rate in Last Two Years: 8.5 (April 2013)
View Larger +
Prev
Next
#7 Burrillville
Latest Unemployment Rate: 10.0
Labor Force: 9,526
Employed: 8,570
Highest Rate in Last Two Years: 11.6 (February 2012)
Lowest Rate in Last Two Years: 8.0 (June 2013)
View Larger +
Prev
Next
#6 Scituate
Latest Unemployment Rate: 10.4
Labor Force: 6,166
Employed: 5,527
Highest Rate in Last Two Years: 11.2 (July 2012)
Lowest Rate in Last Two Years: 8.4 (June 2013)
View Larger +
Prev
Next
#5 Johnston
Latest Unemployment Rate: 10.5
Labor Force: 15,645
Employed: 14,004
Highest Rate in Last Two Years: 12.9 (February 2012)
Lowest Rate in Last Two Years: 9.2 (June 2013)
View Larger +
Prev
Next
#4 Pawtucket
Latest Unemployment Rate: 11.1
Labor Force: 36,412
Employed: 32,378
Highest Rate in Last Two Years: 13.7 (July 2012)
Lowest Rate in Last Two Years: 10.2 (June 2013)
View Larger +
Prev
Next
#3 Woonsocket
Latest Unemployment Rate: 11.2
Labor Force: 20,730
Employed: 18,409
Highest Rate in Last Two Years: 13.6 (January 2012)
Lowest Rate in Last Two Years: 10.7 (June 2013)
View Larger +
Prev
Next
#2 Providence
Latest Unemployment Rate: 11.5
Labor Force: 80,605
Employed: 71,362
Highest Rate in Last Two Years: 14.3 (August 2011)
Lowest Rate in Last Two Years: 10.4 (May 2013)
View Larger +
Prev
Next
#1 Central Falls
Latest Unemployment Rate: 12.1
Labor Force: 8,348
Employed: 7,341
Highest Rate in Last Two Years: 15.3 (January, February 2012)
Lowest Rate in Last Two Years: 11.4 (April 2013)
Related Articles
Enjoy this post? Share it with others.