Roach: My Education Crusade - Why Suspension Stats Don’t Matter
Wednesday, March 12, 2014
Don Roach, GoLocalProv MINDSETTER™
Over the past few months, I’ve been told that there are a number of issues with our Rhode Island schools. We spend too much time “teaching to the test.” We don’t spend enough on education. Teachers’ benefits are too high. Parents need to be more involved.
One thing I haven’t heard is that minorities are disproportionately suspended by RI schools. And yet, according to the RI ACLU that is indeed the case and one of the ills plaguing our school system. They wrote, “The failures of Rhode Island’s school discipline policies have for too long funneled
children–especially children of color –out of the classroom and toward the school-to-prison pipeline.” Yes, in case you weren’t aware there’s a pipeline from Central High School to the ACI by way of Broad Street and school suspensions are the indicator that said pipeline exists, don’t ya know!?
GET THE LATEST BREAKING NEWS HERE -- SIGN UP FOR GOLOCAL FREE DAILY EBLAST
I apologize for the sarcasm, but this type of “analysis” reeks of searching for a problem where none exists. Is the ACLU implying that Rhode Island schools are racist and targeting minority children? That’s really the only conclusion you can draw from their “analysis”. If minority children are getting suspended more than their white peers, racism or at least subjective enforcement must be the culprit. The alternative is that minority children get into more mischief than white children and pay the consequences. So we either live in a racist state or minority children are running amuck.
Sigh.
I really hate groups that spend their time on issues – term used loosely – like this. It’s not that the ACLU’s intention isn’t in the right place; it’s that there are more important education related issues in our state than suspensions. Some of you may have children who’ve been suspended before and I’m sorry that has happened. But when looking at suspension rates, why don’t we spend a few words on an area the ACLU report ignores, namely legitimate bad actions that are being met with suspensions.
There are times kids do things that deserve a suspension. We could argue the merits of in school versus out-of-school suspension, but the ACLU largely ignores how to address bad behavior and instead links suspensions with some form of injustice keeping certain kids from getting an education.
Get real.
Want to reduce suspensions? Stop looking at the race of the student and look at antecedents to bad behavior. Is a child’s home life stable? Did they just get dumped by a girlfriend? Do they have lunch money? Did they wake up on the wrong side of the bed. You know, standard stuff that 21st century kids go through while trying to get an education.
We don’t need to put teachers through some form of diversity training warning them that because 8 percent of the population is a particular minority group, they must ensure they don’t hand out suspensions to that group compared to the other kids more than 8 percent of time. Teachers have enough to think about than making calculations about the racial makeup of disciplined students.
And still the ACLU says this is an issue. Well as I continue my educational crusade when I visit Blackstone Valley Prep tomorrow, I’ll make sure to get the principals thoughts on minority suspensions and see how much sleep he loses over such things.
I’m guessing it’s less than the amount of time it took you to read this.
Don can be reached at [email protected] . You can follow Don on Twitter at @donroach34.
Related Slideshow: RI Home Schooled Students
 View Larger +
Prev
Next
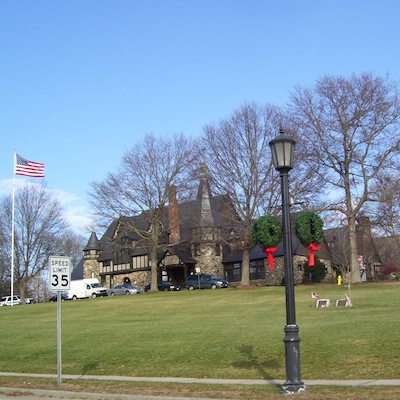
34. Central Falls
Home schooled students per 1,000: 1.1
Total home schooled students: 3
Total public school students in district: 2,694
Note: Data reflects October enrollment period for school year 2013-14.
 View Larger +
Prev
Next
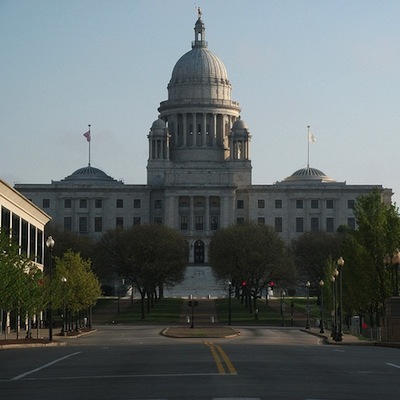
33. Barrington
Home schooled students per 1,000: 3.6
Total home schooled students: 12
Total public school students in district: 3,334
Note: Data reflects October enrollment period for school year 2013-14.
 View Larger +
Prev
Next
32. Providence
Home schooled students per 1,000: 3.7
Total home schooled students: 89
Total public school students in district: 23,827
Note: Data reflects October enrollment period for school year 2013-14.
 View Larger +
Prev
Next
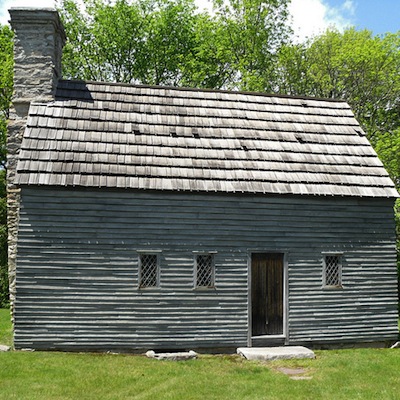
31. North Providence
Home schooled students per 1,000: 6.0
Total home schooled students: 21
Total public school students in district: 3,498
Note: Data reflects October enrollment period for school year 2013-14.
 View Larger +
Prev
Next
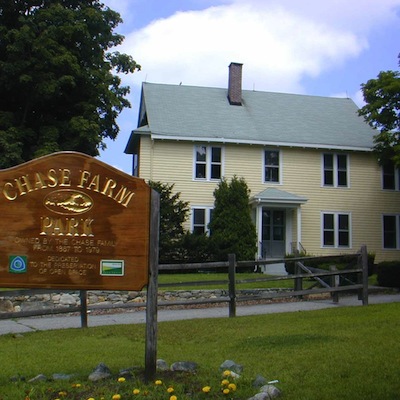
30. Johnston
Home schooled students per 1,000: 6.5
Total home schooled students: 20
Total public school students in district: 3,095
Note: Data reflects October enrollment period for school year 2013-14.
 View Larger +
Prev
Next
29. Lincoln
Home schooled students per 1,000: 7.9
Total home schooled students: 25
Total public school students in district: 3,182
Note: Data reflects October enrollment period for school year 2013-14.
 View Larger +
Prev
Next
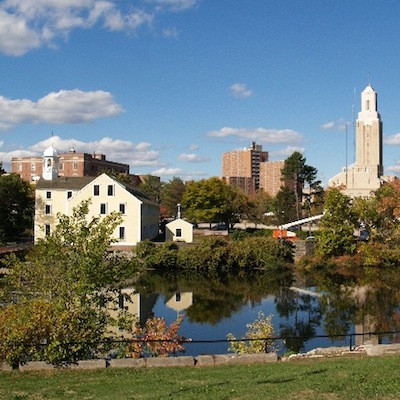
28. Pawtucket
Home schooled students per 1,000: 8.0
Total home schooled students: 15
Total public school students in district: 8,953
Note: Data reflects October enrollment period for school year 2013-14.
 View Larger +
Prev
Next
27. Westerly
Home schooled students per 1,000: 8.3
Total home schooled students: 25
Total public school students in district: 3,016
Note: Data reflects October enrollment period for school year 2013-14.
 View Larger +
Prev
Next
26. North Smithfield
Home schooled students per 1,000: 8.7
Total home schooled students: 15
Total public school students in district: 1,729
Note: Data reflects October enrollment period for school year 2013-14.
 View Larger +
Prev
Next
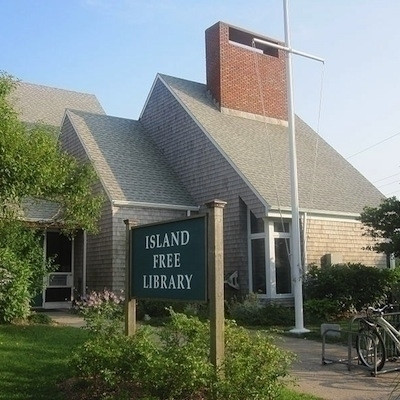
25. New Shoreham
Home schooled students per 1,000: 8.8
Total home schooled students: 1
Total public school students in district: 114
Note: Data reflects October enrollment period for school year 2013-14.
 View Larger +
Prev
Next
24. Bristol-Warren
Home schooled students per 1,000: 9.0
Total home schooled students: 31
Total public school students in district: 3,429
Note: Data reflects October enrollment period for school year 2013-14.
 View Larger +
Prev
Next
23. Cranston
Home schooled students per 1,000: 10.05
Total home schooled students: 106
Total public school students in district: 10,552
Note: Data reflects October enrollment period for school year 2013-14.
View Larger +
Prev
Next
22. South Kingstown
Home schooled students per 1,000: 10.3
Total home schooled students: 35
Total public school students in district: 3,397
Note: Data reflects October enrollment period for school year 2013-14.
View Larger +
Prev
Next
21. Middletown
Home schooled students per 1,000: 10.6
Total home schooled students: 24
Total public school students in district: 2,267
Note: Data reflects October enrollment period for school year 2013-14.
 View Larger +
Prev
Next
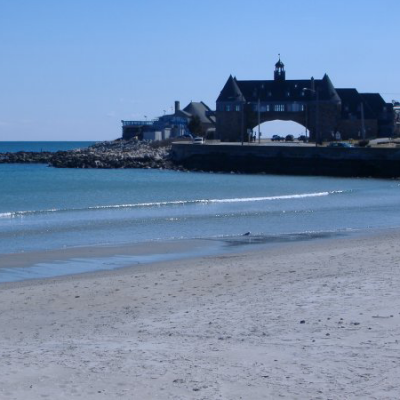
20. Narragansett
Home schooled students per 1,000: 11.5
Total home schooled students: 16
Total public school students in district: 1,396
Note: Data reflects October enrollment period for school year 2013-14.
View Larger +
Prev
Next
19. East Providence
Home schooled students per 1,000: 12.0
Total home schooled students: 64
Total public school students in district: 5,321
Note: Data reflects October enrollment period for school year 2013-14.
 View Larger +
Prev
Next
18. Glocester
Home schooled students per 1,000: 13.2
Total home schooled students: 7
Total public school students in district: 529
Note: Data reflects October enrollment period for school year 2013-14.
 View Larger +
Prev
Next
17. Smithfield
Home schooled students per 1,000: 13.4
Total home schooled students: 32
Total public school students in district: 2,396
Note: Data reflects October enrollment period for school year 2013-14.
 View Larger +
Prev
Next
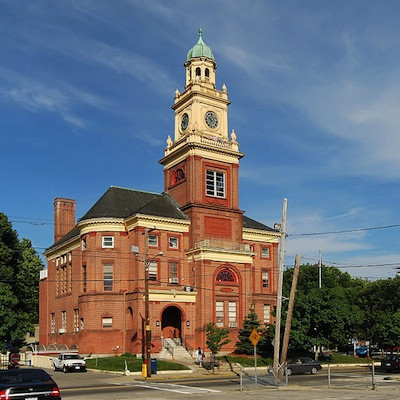
16. Cumberland
Home schooled students per 1,000: 13.5
Total home schooled students: 61
Total public school students in district: 4,531
Note: Data reflects October enrollment period for school year 2013-14.
 View Larger +
Prev
Next
15. Burrillville
Home schooled students per 1,000: 14.2
Total home schooled students: 34
Total public school students in district: 2,401
Note: Data reflects October enrollment period for school year 2013-14.
 View Larger +
Prev
Next
14. Warwick
Home schooled students per 1,000: 14.6
Total home schooled students: 137
Total public school students in district: 9,393
Note: Data reflects October enrollment period for school year 2013-14.
Photo: Flickr/Ken Zirkel
 View Larger +
Prev
Next
13. Jamestown
Home schooled students per 1,000: 15.8
Total home schooled students: 8
Total public school students in district: 507
Note: Data reflects October enrollment period for school year 2013-14.
 View Larger +
Prev
Next
12. North Kingstown
Home schooled students per 1,000: 16.5
Total home schooled students: 67
Total public school students in district: 4,056
Note: Data reflects October enrollment period for school year 2013-14.
Photo: Flickr/C. Hanchey
 View Larger +
Prev
Next
11. Coventry
Home schooled students per 1,000: 16.6
Total home schooled students: 83
Total public school students in district: 4,992
Note: Data reflects October enrollment period for school year 2013-14.
View Larger +
Prev
Next
10. Portsmouth
Home schooled students per 1,000: 17.0
Total home schooled students: 45
Total public school students in district: 2,647
Note: Data reflects October enrollment period for school year 2013-14.
 View Larger +
Prev
Next
9. Foster-Glocester
Home schooled students per 1,000: 17.3
Total home schooled students: 20
Total public school students in district: 1,153
Note: Data reflects October enrollment period for school year 2013-14.
 View Larger +
Prev
Next
8. Woonsocket
Home schooled students per 1,000: 17.9
Total home schooled students: 106
Total public school students in district: 5,920
Note: Data reflects October enrollment period for school year 2013-14.
View Larger +
Prev
Next
7. West Warwick
Home schooled students per 1,000: 18.4
Total home schooled students: 63
Total public school students in district: 3,421
Note: Data reflects October enrollment period for school year 2013-14.
View Larger +
Prev
Next
6. Scituate
Home schooled students per 1,000: 18.7
Total home schooled students: 27
Total public school students in district: 1,448
Note: Data reflects October enrollment period for school year 2013-14.
 View Larger +
Prev
Next
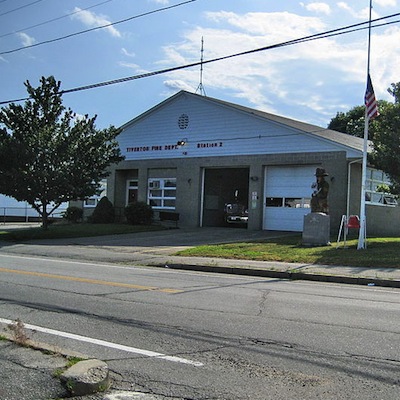
5. Tiverton
Home schooled students per 1,000: 20.3
Total home schooled students: 38
Total public school students in district: 1,873
Note: Data reflects October enrollment period for school year 2013-14.
 View Larger +
Prev
Next
4. Newport
Home schooled students per 1,000: 23.5
Total home schooled students: 47
Total public school students in district: 1,996
Note: Data reflects October enrollment period for school year 2013-14.
View Larger +
Prev
Next
3. Foster
Home schooled students per 1,000: 25.7
Total home schooled students: 7
Total public school students in district: 272
Note: Data reflects October enrollment period for school year 2013-14.
 View Larger +
Prev
Next
2. Chariho
Home schooled students per 1,000: 26.8
Total home schooled students: 92
Total public school students in district: 3,427
Note: Data reflects October enrollment period for school year 2013-14.
 View Larger +
Prev
Next
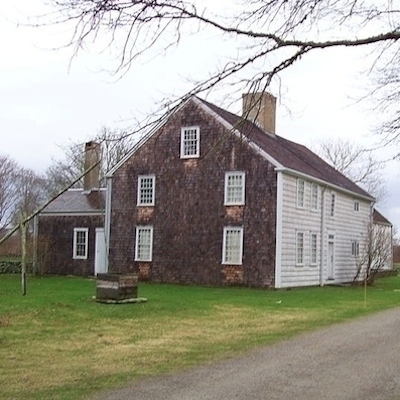
1. Little Compton
Home schooled students per 1,000: 42.3
Total home schooled students: 11
Total public school students in district: 260
Note: Data reflects October enrollment period for school year 2013-14.
Enjoy this post? Share it with others.


