John Perilli: With New Climate Rule, EPA Must Step Up to Plate
Wednesday, June 04, 2014
John Perilli, GoLocalProv MINDSETTER™
View Larger +
With President Obama’s new climate regulation, our fight against climate change rests in the hands of the EPA, believes John Perilli
For the past year, the chief exports of our federal government have been cars, oil and disappointment.
President Barack Obama managed to keep a clean record during his first term, but his second term has featured one scandal after another. The botched introduction of Healthcare.gov sent Democratic approval ratings, flying high after the federal shutdown, into a desperate tailspin, and eventually claimed the cabinet post of Health and Human Services Secretary Kathleen Sebelius. More recently the shameful Veterans’ Affairs scandal, where long wait times at vets’ hospitals were covered up, forced VA Secretary Eric Shinseki to resign. The problem isn’t even close to being solved.
GET THE LATEST BREAKING NEWS HERE -- SIGN UP FOR GOLOCAL FREE DAILY EBLAST
In all this chaos, the President has introduced one of his most ambitious reforms since Obamacare: a new regulation that will impose a 30 percent cut on carbon pollution emitted by coal-fired power plants. Many environmentalists rejoiced at this change of pace by an administration which has given natural gas prospectors and the Keystone XL pipeline free passes, but the work is not done yet. The rule does not go into effect until 2015, and when it does, the brunt of the legwork will be borne by the Environmental Protection Agency.
Are you seeing a trend here?
Like HHS and the VA, the EPA is a powerful but ultimately fallible federal agency. It is subject to the same laws of bureaucracy and mismanagement that brought down Kathleen Sebelius and Eric Shinseki, and the stakes could not be higher. With the threat of a changing climate looming, the EPA better be ready to play ball––or it will damage our struggle against climate change beyond repair.
Our Roasting Planet
Unfortunately, the grim facts of climate change are becoming clearer every day, but it’s worth a quick refresher.
Climate change is one of those devilish things which is easy to dismiss because it is so hard to see, but it is a terribly real process. It is the slow warming of our planet as carbon dioxide emitted from burnt fossil fuels like coal and gasoline rises into our atmosphere and traps the heat in. It has already resulted in a record recession of glaciers and polar icecaps, and will continue to raise sea levels and intensify weather patterns until it causes widespread floods, destruction of property and population displacement.
Every major scientific body in every developed country in the world knows this is true
The US is the second largest carbon dioxide polluter in the world, after the dirty growing economy of China. And of all the US’s carbon emissions, 38 percent is supplied by power plants, the worst offenders of which are old, coal-fired power plants. Coal is by far the most pollution-intensive fossil fuel, and it makes crude oil and natural gas look positively green.
The idea behind the 30 percent cut to existing coal emissions is that it strikes at the snake’s head: It imposes a hard constraint on the worst polluting power plants in one of the worst polluting countries. The hope is that such a strike will be enough to avert, or at least alleviate, the worst effects of climate change. We may yet dodge a bullet, or perhaps a raging flood.
Tempting Fate
Despite its honorable intentions, though, the EPA is taking a daring route. By going all in to stop carbon pollution, Obama and EPA administrator Gina McCarthy are tempting an old political demon I like to call the “issue cycle.”
There are many issues in politics, but the ones that get taken care of first are not determined at random. They are a product of a delicate system of agenda politics, involving elections, public opinion, and the priorities of the various branches of government. When an issue comes to the forefront, it is either addressed to some degree or sent to the back of the line, sometimes for as long as twenty years.
Take healthcare, for example. The push for expanded access to healthcare in the United States began in earnest under Franklin D. Roosevelt in the 1930s, and was realized in the creation of the Social Security Administration and the New Deal as a whole. After this success, the issue lay dormant for a quarter century, until it was picked up by Lyndon Johnson in the mid-1960s. He instituted Medicare and Medicaid as part of his “Great Society” agenda, and tried to implement a national healthcare program as well, but his toxic involvement in Vietnam ensured that his ambitions would be incomplete.
Skip ahead another twenty-five years to the Clinton Administration and its noble but unsuccessful attempt to create a nationwide healthcare system. Healthcare reform had waited its turn, but again reform failed to pass. The issue did not come to a head again until the Obama Administration, where a compromise individual-mandate system barely passed along party lines.
If you’re hoping for another round of nationwide healthcare reform, I hate to let you down. It’s going to be awhile.
This cycle can be traced with any number of economic issues: spending policy, monetary policy, energy. The length of the cycle might vary, but the trend is the same: State your case, or let the next customer come to the window.
With this most recent climate regulation, President Obama and the EPA are cutting the climate issue to the front of the queue. It has not been truly front and center since amendments to the groundbreaking Clean Air Act were passed in 1990, and before that, in 1970. If history is being honest with us, this push by the EPA could be our most significant advance on climate change until at least the 2030s.
The Pressure Is On
For our sake, the EPA better be ready to roll. The forces of climate change will not wait another petty political cycle to submerge us, and the climate rule may be our last hope. It will have to withstand numerous legal challenges, like the ones that almost sank Obamacare. It will have to successfully implement a dangerous plan of letting each state draft an emissions reduction plan or risk federal intrusion, which looks a bit too much like the health exchanges. It will have to last through potentially unfriendly future administrations who might try to dismantle it.
It will have to work.
We had all better hope that EPA Administrator Gina McCarthy isn’t shown the door in the same manner as Kathleen Sebelius and Eric Shinseki––in the wake of a scandal. We had all better hope everyone at the EPA has their wits and competence about them. They have the weight of our slowly boiling world on their shoulders.
John Perilli is a native of Cumberland, RI and a rising senior at Brown University. He works for Magaziner for Treasurer. The opinions presented in this piece do not represent the opinions of any organizations John Perilli is affiliated with.
Related Slideshow: Natural Disasters: RI’s Most At Risk and Vulnerable Communities
The below slides show what communities are at greatest risk and most vulnerable to a particular natural disaster, such as another hurricane, or a less-common disaster, such as an earthquake or a tornado. Higher scores correspond to a higher risk and vulnerability for that community. Cities and towns are listed starting with those that have the least risk and vulnerability, ending with the most at-risk and most vulnerable. Because flooding is a particular concern to Rhode Islanders, additional information on the threat of flooding from a major 100-year storm is shown.
Scoring method
The score for each type of hazard was determined by multiplying two separate scores together: the hazard risk score and the vulnerability score. The hazard risk score was calculated by multiplying three scores together: the score for frequency (how often something happens), the score for area impact (area that would be affected), and the score for intensity (such as the depth of a flood or the wind speed of a three-second gust in a hurricane). Higher scores mean a higher risk. The vulnerability score was derived using a similar multi-layered calculation that takes into account the population size and characteristics (for example, elderly and low-income populations are more vulnerable), the economy, the environment, and the number and importance of critical facilities like hospitals or power stations. Higher scores mean a greater vulnerability.
The scores are not against any scale. Instead they are relative in nature, showing how risk and vulnerability for a natural disaster is distributed throughout the state. A community with a higher score has a greater share of risk and vulnerability than one with a lower score. Scores and method information are from 2011 State Hazard Mitigation Plan. (A 2014 updated plan has been recently released, but numerical scores are not provided for each community.) For a detailed description of the entire scoring method, see PDF pages 123 to 145 on the 2011 plan.
 View Larger +
Prev
Next
#39 Little Compton
Natural Hazard Scores
Wind Score: 160
Flood Score: 18
Earthquake Score: 60
Tornado Score: 16
Snow Score: 50
Total Score: 424
Flood Damage
Rank: 14
Acres at Risk of Flooding: 2,516
Percent of Total Acres in Community at Risk: 16.78%
Hurricane Coastal Flooding
Number of Residents in Evac. Zone: 1,160
Number of Buildings at Risk: 187
Photo: Flickr/Al Carmadella Jr.
 View Larger +
Prev
Next
#38 Richmond
Natural Hazard Scores
Wind Score: 200
Flood Score: 18
Earthquake Score: 90
Tornado Score: 24
Snow Score: 75
Total Score: 587
Flood Damage
Rank: 24
Acres at Risk of Flooding: 2,945
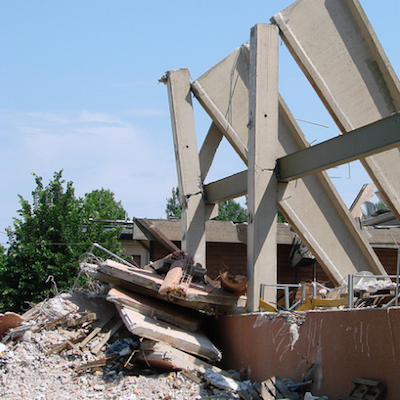
Percent of Total Acres in Community at Risk: 11.35%
Hurricane Coastal Flooding
Number of Residents in Evac. Zone: N/A
Number of Buildings at Risk: N/A
 View Larger +
Prev
Next
#37 Exeter
Natural Hazard Scores
Wind Score: 240
Flood Score: 0
Earthquake Score: 90
Tornado Score: 24
Snow Score: 75
Total Score: 609
Flood Damage
Rank: 36
Acres at Risk of Flooding: 2,190
Percent of Total Acres in Community at Risk: 5.78%
Hurricane Coastal Flooding
Number of Residents in Evac. Zone: N/A
Number of Buildings at Risk: N/A
Photo: Flickr/UCL Mathematical
 View Larger +
Prev
Next
#36 West Greenwich
Natural Hazard Scores
Wind Score: 240
Flood Score: 0
Earthquake Score: 90
Tornado Score: 24
Snow Score: 75
Total Score: 609
Flood Damage
Rank: 39
Acres at Risk of Flooding: 1,197
Percent of Total Acres in Community at Risk: 3.62%
Hurricane Coastal Flooding
Number of Residents in Evac. Zone: N/A
Number of Buildings at Risk: N/A
Photo: Flickr/born1945
 View Larger +
Prev
Next
#35 New Shoreham
Natural Hazard Scores
Wind Score: 300
Flood Score: 27
Earthquake Score: 90
Tornado Score: 24
Snow Score: 75
Total Score: 696
Flood Damage
Rank: 13
Acres at Risk of Flooding: 1,220
Percent of Total Acres in Community at Risk: 17.3%
Hurricane Coastal Flooding
Number of Residents in Evac. Zone: 840
Number of Buildings at Risk: 20
Photo: Flickr/Al Camardella Jr.
.png) View Larger +
View Larger +
Prev
Next
#34 Foster
Natural Hazard Scores
Wind Score: 180
Flood Score: 18
Earthquake Score: 120
Tornado Score: 32
Snow Score: 200
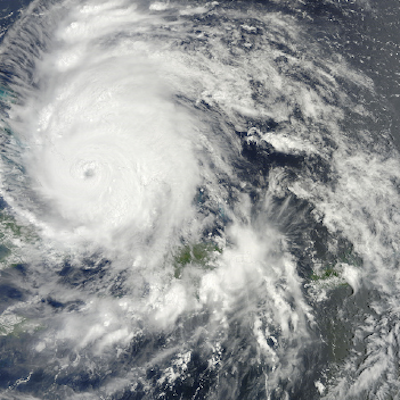
Total Score: 790
Flood Damage
Rank: 28
Acres at Risk of Flooding: 2,659
Percent of Total Acres in Community at Risk: 7.94%
Hurricane Coastal Flooding
Number of Residents in Evac. Zone: N/A
Number of Buildings at Risk: N/A
Photo: Flickr/US Geological Survey
 View Larger +
Prev
Next
#33 Jamestown
Natural Hazard Scores
Wind Score: 480
Flood Score: 54
Earthquake Score: 180
Tornado Score: 48
Snow Score: 150
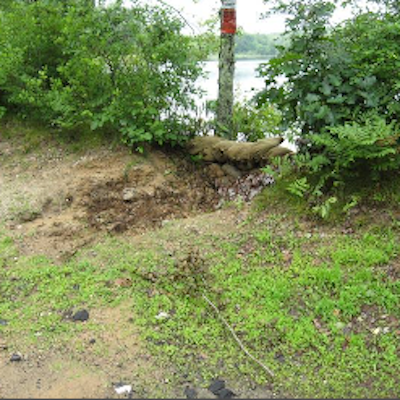
Total Score: 1,272
Flood Damage
Rank: 20
Acres at Risk of Flooding: 766
Percent of Total Acres in Community at Risk: 11.95%
Hurricane Coastal Flooding
Number of Residents in Evac. Zone: 3,910
Number of Buildings at Risk: 108
Photo: Flickr/NASA Goddard
 View Larger +
Prev
Next
#32 Hopkinton
Natural Hazard Scores
Wind Score: 600
Flood Score: 54
Earthquake Score: 210
Tornado Score: 56
Snow Score: 175
Total Score: 1,515
Flood Damage
Rank: 21
Acres at Risk of Flooding: 3,412
Percent of Total Acres in Community at Risk: 11.86%
Hurricane Coastal Flooding
Number of Residents in Evac. Zone: N/A
Number of Buildings at Risk: N/A
 View Larger +
Prev
Next
#31 North Smithfield
Natural Hazard Scores
Wind Score: 480
Flood Score: 27
Earthquake Score: 210
Tornado Score: 56
Snow Score: 350
Total Score: 1,543
Flood Damage
Rank: 26
Acres at Risk of Flooding: 1,727
Percent of Total Acres in Community at Risk: 10.63%
Hurricane Coastal Flooding
Number of Residents in Evac. Zone: N/A
Number of Buildings at Risk: N/A
Photo: Flickr/ilovemypit
.png) View Larger +
View Larger +
Prev
Next
#30 Charlestown
Natural Hazard Scores
Wind Score: 680
Flood Score: 144
Earthquake Score: 210
Tornado Score: 56
Snow Score: 175
Total Score: 1,685
Flood Damage
Rank: 4
Acres at Risk of Flooding: 9,276
Percent of Total Acres in Community at Risk: 34.08%
Hurricane Coastal Flooding
Number of Residents in Evac. Zone: 2,510
Number of Buildings at Risk: 838
.png) View Larger +
View Larger +
Prev
Next
#29 Glocester
Natural Hazard Scores
Wind Score: 500
Flood Score: 27
Earthquake Score: 240
Tornado Score: 64
Snow Score: 400
Total Score: 1,711
Flood Damage
Rank: 34
Acres at Risk of Flooding: 2,271
Percent of Total Acres in Community at Risk: 6.2%
Hurricane Coastal Flooding
Number of Residents in Evac. Zone: N/A
Number of Buildings at Risk: N/A
Photo: Flickr/Michael Dolan
 View Larger +
Prev
Next
#28 East Greenwich
Natural Hazard Scores
Wind Score: 720
Flood Score: 63
Earthquake Score: 270
Tornado Score: 72
Snow Score: 225
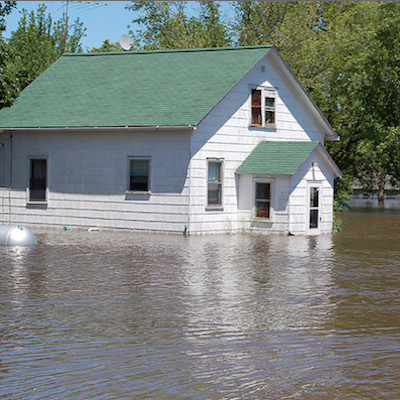
Total Score: 1,890
Flood Damage
Rank: 17
Acres at Risk of Flooding: 1,500
Percent of Total Acres in Community at Risk: 14.03%
Hurricane Coastal Flooding
Number of Residents in Evac. Zone: 1,240
Number of Buildings at Risk: N/A
Photo: Flickr/Sean Naber
 View Larger +
Prev
Next
#27 Scituate
Natural Hazard Scores
Wind Score: 500
Flood Score: 99
Earthquake Score: 270
Tornado Score: 72
Snow Score: 450
Total Score: 1,931
Flood Damage
Rank: 11
Acres at Risk of Flooding: 6,368
Percent of Total Acres in Community at Risk: 17.98%
Hurricane Coastal Flooding
Number of Residents in Evac. Zone: N/A
Number of Buildings at Risk: N/A
Photo: Flickr/US Geological Survey
 View Larger +
Prev
Next
#26 Middletown
Natural Hazard Scores
Wind Score: 800
Flood Score: 36
Earthquake Score: 300
Tornado Score: 80
Snow Score: 250
Total Score: 2,066
Flood Damage
Rank: 37
Acres at Risk of Flooding: 499
Percent of Total Acres in Community at Risk: 5.63%
Hurricane Coastal Flooding
Number of Residents in Evac. Zone: 2,012
Number of Buildings at Risk: N/A
Photo: Flickr/Ani Carrington
 View Larger +
Prev
Next
#25 Central Falls
Natural Hazard Scores
Wind Score: 740
Flood Score: 36
Earthquake Score: 300
Tornado Score: 80
Snow Score: 500
Total Score: 2,256
Flood Damage
Rank: 16
Acres at Risk of Flooding: 121
Percent of Total Acres in Community at Risk: 14.58%
Hurricane Coastal Flooding
Number of Residents in Evac. Zone: N/A
Number of Buildings at Risk: N/A
 View Larger +
Prev
Next
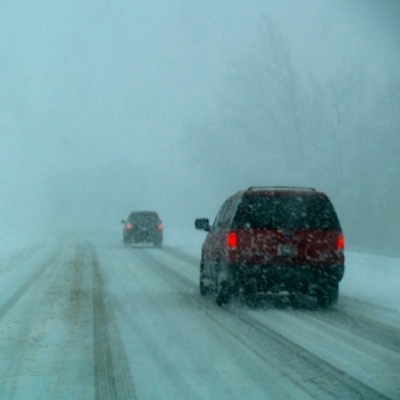
#24 Tiverton
Natural Hazard Scores
Wind Score: 880
Flood Score: 54
Earthquake Score: 330
Tornado Score: 88
Snow Score: 275
Total Score: 2,287
Flood Damage
Rank: 22
Acres at Risk of Flooding: 2,335
Percent of Total Acres in Community at Risk: 11.51%
Hurricane Coastal Flooding
Number of Residents in Evac. Zone: 3,080
Number of Buildings at Risk: 191
 View Larger +
Prev
Next
#23 Warren
Natural Hazard Scores
Wind Score: 800
Flood Score: 198
Earthquake Score: 330
Tornado Score: 88
Snow Score: 275
Total Score: 2,351
Flood Damage
Rank: 5
Acres at Risk of Flooding: 1,431
Percent of Total Acres in Community at Risk: 33.99%
Hurricane Coastal Flooding
Number of Residents in Evac. Zone: 7,520
Number of Buildings at Risk: 534
 View Larger +
Prev
Next
#22 Lincoln
Natural Hazard Scores
Wind Score: 740
Flood Score: 45
Earthquake Score: 360
Tornado Score: 96
Snow Score: 600
Total Score: 2,561
Flood Damage
Rank: 35
Acres at Risk of Flooding: 752
Percent of Total Acres in Community at Risk: 6.12%
Hurricane Coastal Flooding
Number of Residents in Evac. Zone: N/A
Number of Buildings at Risk: N/A
 View Larger +
Prev
Next
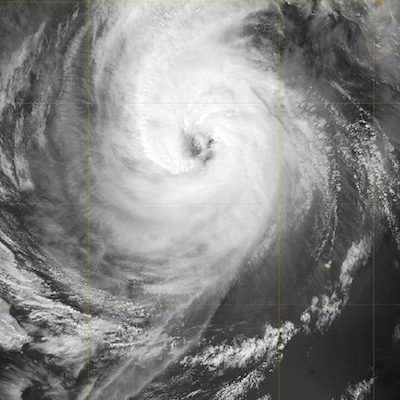
#21 Narragansett
Natural Hazard Scores
Wind Score: 1,180
Flood Score: 198
Earthquake Score: 390
Tornado Score: 104
Snow Score: 325
Total Score: 2,977
Flood Damage
Rank: 2
Acres at Risk of Flooding: 4,224
Percent of Total Acres in Community at Risk: 39.2
Hurricane Coastal Flooding
Number of Residents in Evac. Zone: 9,030
Number of Buildings at Risk: N/A
 View Larger +
Prev
Next
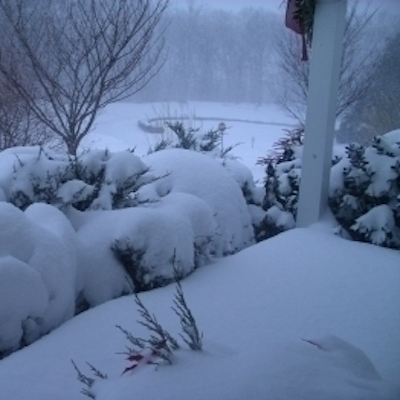
#20 Portsmouth
Natural Hazard Scores
Wind Score: 1,120
Flood Score: 216
Earthquake Score: 420
Tornado Score: 112
Snow Score: 350
Total Score: 3,058
Flood Damage
Rank: 7
Acres at Risk of Flooding: 4,238
Percent of Total Acres in Community at Risk: 26.64
Hurricane Coastal Flooding
Number of Residents in Evac. Zone: 6,530
Number of Buildings at Risk: 1,078
Photo: Flickr/Core Burn
 View Larger +
Prev
Next
#19 Smithfield
Natural Hazard Scores
Wind Score: 920
Flood Score: 72
Earthquake Score: 420
Tornado Score: 112
Snow Score: 700
Total Score: 3,094
Flood Damage
Rank: 30
Acres at Risk of Flooding: 1,201
Percent of Total Acres in Community at Risk: 6.74%
Hurricane Coastal Flooding
Number of Residents in Evac. Zone: N/A
Number of Buildings at Risk: N/A
View Larger +
Prev
Next
#18 Barrington
Natural Hazard Scores
Wind Score: 860
Flood Score: 243
Earthquake Score: 420
Tornado Score: 112
Snow Score: 600
Total Score: 3,066
Flood Damage
Rank: 1
Acres at Risk of Flooding: 2,417
Percent of Total Acres in Community at Risk: 40.97%
Hurricane Coastal Flooding
Number of Residents in Evac. Zone: 13,890
Number of Buildings at Risk: 784
 View Larger +
Prev
Next
#17 Bristol
Natural Hazard Scores
Wind Score: 1,200
Flood Score: 135
Earthquake Score: 480
Tornado Score: 128
Snow Score: 400
Total Score: 3,303
Flood Damage
Rank: 8
Acres at Risk of Flooding: 1,745
Percent of Total Acres in Community at Risk: 26.28
Hurricane Coastal Flooding
Number of Residents in Evac. Zone: 5,330
Number of Buildings at Risk: 483
 View Larger +
Prev
Next
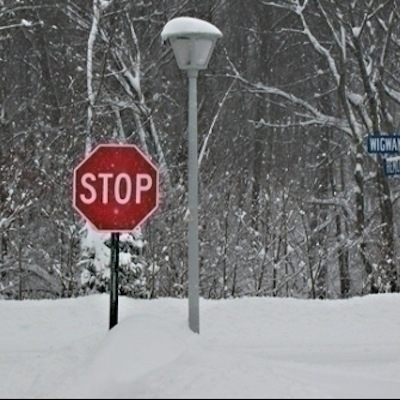
#16 Coventry
Natural Hazard Scores
Wind Score: 1,160
Flood Score: 81
Earthquake Score: 480
Tornado Score: 128
Snow Score: 550
Total Score: 3,359
Flood Damage
Rank: 38
Acres at Risk of Flooding: 2,147
Percent of Total Acres in Community at Risk: 5.26%
Hurricane Coastal Flooding
Number of Residents in Evac. Zone: N/A
Number of Buildings at Risk: N/A
 View Larger +
Prev
Next
#15 Burrillville
Natural Hazard Scores
Wind Score: 906
Flood Score: 63
Earthquake Score: 510
Tornado Score: 136
Snow Score: 850
Total Score: 3,539
Flood Damage
Rank: 32
Acres at Risk of Flooding: 2,394
Percent of Total Acres in Community at Risk: 6.39
Hurricane Coastal Flooding
Number of Residents in Evac. Zone: N/A
Number of Buildings at Risk: N/A
 View Larger +
Prev
Next
#14 Johnston
Natural Hazard Scores
Wind Score: 1,180
Flood Score: 18
Earthquake Score: 510
Tornado Score: 136
Snow Score: 850
Total Score: 3,714
Flood Damage
Rank: 25
Acres at Risk of Flooding: 1,677
Percent of Total Acres in Community at Risk: 10.7%
Hurricane Coastal Flooding
Number of Residents in Evac. Zone: N/A
Number of Buildings at Risk: N/A
.png) View Larger +
View Larger +
Prev
Next
#13 South Kingstown
Natural Hazard Scores
Wind Score: 1,580
Flood Score: 171
Earthquake Score: 540
Tornado Score: 144
Snow Score: 450
Total Score: 3,965
Flood Damage
Rank: 6
Acres at Risk of Flooding: 12,168
Percent of Total Acres in Community at Risk: 29.51
Hurricane Coastal Flooding
Number of Residents in Evac. Zone: 7,310
Number of Buildings at Risk: 1,315
 View Larger +
Prev
Next
#12 Cumberland
Natural Hazard Scores
Wind Score: 1,180
Flood Score: 117
Earthquake Score: 600
Tornado Score: 160
Snow Score: 1,000
Total Score: 4,257
Flood Damage
Rank: 23
Acres at Risk of Flooding: 2,098
Percent of Total Acres in Community at Risk: 11.46%
Hurricane Coastal Flooding
Number of Residents in Evac. Zone: N/A
Number of Buildings at Risk: N/A
.png) View Larger +
View Larger +
Prev
Next
#11 Westerly
Natural Hazard Scores
Wind Score: 1,880
Flood Score: 189
Earthquake Score: 570
Tornado Score: 152
Snow Score: 475
Total Score: 4,406
Flood Damage
Rank: 9
Acres at Risk of Flooding: 5,604
Percent of Total Acres in Community at Risk: 26.15%
Hurricane Coastal Flooding
Number of Residents in Evac. Zone: 7,120
Number of Buildings at Risk: 1,342
 View Larger +
Prev
Next
#10 West Warwick
Natural Hazard Scores
Wind Score: 1,480
Flood Score: 99
Earthquake Score: 660
Tornado Score: 176
Snow Score: 925
Total Score: 4,660
Flood Damage
Rank: 19
Acres at Risk of Flooding: 629
Percent of Total Acres in Community at Risk: 12.21%
Hurricane Coastal Flooding
Number of Residents in Evac. Zone: N/A
Number of Buildings at Risk: N/A
 View Larger +
Prev
Next
#9 North Providence
Natural Hazard Scores
Wind Score: 1,400
Flood Score: 81
Earthquake Score: 690
Tornado Score: 184
Snow Score: 1,150
Total Score: 4,885
Flood Damage
Rank: 33
Acres at Risk of Flooding: 238
Percent of Total Acres in Community at Risk: 6.3%
Hurricane Coastal Flooding
Number of Residents in Evac. Zone: N/A
Number of Buildings at Risk: N/A
 View Larger +
Prev
Next
#8 North Kingstown
Natural Hazard Scores
Wind Score: 1,760
Flood Score: 297
Earthquake Score: 690
Tornado Score: 184
Snow Score: 575
Total Score: 4,886
Flood Damage
Rank: 10
Acres at Risk of Flooding: 5,538
Percent of Total Acres in Community at Risk: 19.12%
Hurricane Coastal Flooding
Number of Residents in Evac. Zone: 7,820
Number of Buildings at Risk: 850
Photo: Flickr/Jessica Merz
 View Larger +
Prev
Next
#7 Newport
Natural Hazard Scores
Wind Score: 1,880
Flood Score: 306
Earthquake Score: 720
Tornado Score: 192
Snow Score: 600
Total Score: 5,138
Flood Damage
Rank: 3
Acres at Risk of Flooding: 2,078
Percent of Total Acres in Community at Risk: 37.24%
Hurricane Coastal Flooding
Number of Residents in Evac. Zone: 10,590
Number of Buildings at Risk: 993
Photo: Flickr/ChalkyLives
 View Larger +
Prev
Next
#6 Woonsocket
Natural Hazard Scores
Wind Score: 2,260
Flood Score: 99
Earthquake Score: 1,110
Tornado Score: 296
Snow Score: 1,850
Total Score: 7,835
Flood Damage
Rank: 29
Acres at Risk of Flooding: 356
Percent of Total Acres in Community at Risk: 6.95%
Hurricane Coastal Flooding
Number of Residents in Evac. Zone: N/A
Number of Buildings at Risk: N/A
 View Larger +
Prev
Next
#5 East Providence
Natural Hazard Scores
Wind Score: 2,720
Flood Score: 225
Earthquake Score: 1,410
Tornado Score: 376
Snow Score: 2,350
Total Score: 9,901
Flood Damage
Rank: 12
Acres at Risk of Flooding: 1,610
Percent of Total Acres in Community at Risk: 17.37%
Hurricane Coastal Flooding
Number of Residents in Evac. Zone: 7,430
Number of Buildings at Risk: N/A
 View Larger +
Prev
Next
#4 Cranston
Natural Hazard Scores
Wind Score: 3,820
Flood Score: 360
Earthquake Score: 1,950
Tornado Score: 520
Snow Score: 3,250
Total Score: 13,800
Flood Damage
Rank: 27
Acres at Risk of Flooding: 1,541
Percent of Total Acres in Community at Risk: 8.25%
Hurricane Coastal Flooding
Number of Residents in Evac. Zone: 2,330
Number of Buildings at Risk: 640
.png) View Larger +
View Larger +
Prev
Next
#3 Pawtucket
Natural Hazard Scores
Wind Score: 4,880
Flood Score: 117
Earthquake Score: 2,160
Tornado Score: 576
Snow Score: 3,600
Total Score: 15,653
Flood Damage
Rank: 31
Acres at Risk of Flooding: 392
Percent of Total Acres in Community at Risk: 6.7%
Hurricane Coastal Flooding
Number of Residents in Evac. Zone: 1,150
Number of Buildings at Risk: N/A
 View Larger +
Prev
Next
#2 Warwick
Natural Hazard Scores
Wind Score: 5,400
Flood Score: 684
Earthquake Score: 2,400
Tornado Score: 640
Snow Score: 2,875
Total Score: 16,799
Flood Damage
Rank: 15
Acres at Risk of Flooding: 3,923
Percent of Total Acres in Community at Risk: 16.51%
Hurricane Coastal Flooding
Number of Residents in Evac. Zone: 28,760
Number of Buildings at Risk: 2,594
 View Larger +
Prev
Next
#1 Providence
Natural Hazard Scores
Wind Score: 10,980
Flood Score: 486
Earthquake Score: 5,850
Tornado Score: 1,560
Snow Score: 9,750
Total Score: 40,326
Flood Damage
Rank: 18
Acres at Risk of Flooding: 1,669
Percent of Total Acres in Community at Risk: 13.58%
Hurricane Coastal Flooding
Number of Residents in Evac. Zone: 1,010
Number of Buildings at Risk: 481
Related Articles
Enjoy this post? Share it with others.


.png)


.png)
.png)


.png)

.png)


.png)


_80_80_c1.png)


_80_80_c1.png)
_80_80_c1.png)


_80_80_c1.png)

_80_80_c1.png)


_80_80_c1.png)


