RI Has One School System That Has Worse Test Scores Than Providence - The State Runs It

Wednesday, July 10, 2019


View Larger +

The man who pushed for the State of Rhode Island taking over Central Falls schools in the early 1990s is raising concerns about a state takeover of the Providence schools.

Former Central Falls Mayor Tom Lazieh told GoLocalProv.com this week that he lobbied then-Governor Bruce Sundlun to take over the underperforming Central Falls schools system in hopes of better financial support and stronger educational outcomes, but now more than two-plus decades later, the former Mayor says the experiment has been an educational failure.

“The State takeover of schools doesn’t mean better quality,” said Lazieh. And he has words of warning about a Providence takeover.

GET THE LATEST BREAKING NEWS HERE -- SIGN UP FOR GOLOCAL FREE DAILY EBLAST

Providence at Crossroads

Providence schools' performance on the state’s new comprehensive tests mirrored on the Massachusetts model -- RICAS -- were an embarrassment and in part lead to a comprehensive assessment by Johns Hopkins University.

The Wall Street Journal has named Providence “an education horror show — a case study in public school failure and lack of accountability.”

However, if Providence is a horror show, then what are the Central Falls schools?

View Larger +

Central Falls High School

According to last November’s RICAS scores only 13.7 percent of Providence students meet or exceed expectations for English Language Arts (ELA).

So if Providence’s ELA scores are deplorable, what term should be used to describe Central Falls' ELA scores — only 9.6 percent on Central Falls students meet or exceed expectations for ELA — 30 percent lower than Providence students.

Math scores on the RICAS were even worse. Only 10.3 percent of Providence students meet or exceeded the standard for math, but that was 33 percent higher than the state-run Central Falls students. Only 6.9 percent of Central Falls students met or exceeded the standards for math.

Central Falls a "Failure"

Lazieh says “the state has failed.”

Similarly, Gary Sasse, the former Director of Administration for the State of Rhode Island said on GoLocal LIVE’s Business Monday, that there was a significant opportunity to improve education in Central Falls and the state has failed the children of Central Falls.

“RIDE dropped the ball -- now what's to say that RIDE won’t drop the ball again is a fair question,” said Sasse.

Now, the Superintendent of the Central Falls school system Victor Capellan is moving to RIDE to be involved in the state intervention of Providence Schools. He refused to respond to requests for an interview on the performance of Central Falls schools under his tenure.

View Larger +

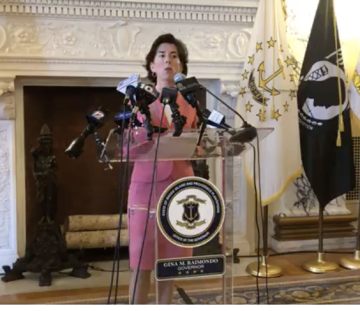
Governor Raimondo discussing the Johns Hopkins findings. Photo: GoLocalProv

Capellan has been in the past a possible name for Mayor of Providence and even has a “Friends of Victor Capellan” political page on Facebook.

“All the numbers [in Central Falls] are disappointing. We should have done better," says Lazieh. “It was a perfect opportunity to turn the school system around.”

Providence Takeover Warning

Lazieh warns about a state takeover of Providence, “I don’t know if it is realistic to takeover [Providence]. The size....the expense. It is too much.”

Lazieh joins others in calling for Rhode Island to guarantee quality education. “Rhode Island children should have a right to quality education,” said Lazieh.


Related Slideshow: 2017-2018 RICAS ELA Rankings for “Meeting or Exceeding Expectations”

The Rhode Island Department of Education (RIDE) released performance results on November 29, 2018 for students in grades 3 through 8 on the Rhode Island Comprehensive Assessment System, or RICAS. The 2017-2018 school year was the first year of implementation for the RICAS, which is the Rhode Island administration of the Massachusetts Comprehensive Assessment System (MCAS), the assessment tool of the nation’s highest-performing state for public education.

Data was suppressed to "ensure confidentiality" for Urban Collaborative and the RI School for the Deaf because greater than 95% of students did not meet expectations; data was suppressed to "ensure confidentiality" for DCYF because the minimum reporting size of ten was not met. 

Below are the rankings of school districts -- and charter schools -- with the data provided by RIDE.

View Larger +
Prev Next

#49

Central Falls

Students meeting or exceeding expectations: 

9.66%

View Larger +
Prev Next

#48

Woonsocket

Students meeting or exceeding expectations:

12.52%

View Larger +
Prev Next

#47

Providence

Students meeting or exceeding expectations: 

13.71%

View Larger +
Prev Next

#46

Highlander Charter School

Students meeting or exceeding expectations: 

15.06%

View Larger +
Prev Next

#45

Trinity Academy for Performing Arts

Students meeting or exceeding expectations: 

15.38%

View Larger +
Prev Next

#44

Paul Cuffee Charter School

Students meeting or exceeding expectations: 

15.7%

View Larger +
Prev Next

#43

Beacon Charter School 

Students meeting or exceeding expectations: 

19.23%

View Larger +
Prev Next

#42

Pawtucket

Students meeting or exceeding expectations: 

20.48%

View Larger +
Prev Next

#41

Newport

Students meeting or exceeding expectations: 

22.6%

View Larger +
Prev Next

#40

Southside Charter School

Students meeting or exceeding expectations: 

22.73%

View Larger +
Prev Next

#39

Burrillville

Students meeting or exceeding expectations: 

24.92%

View Larger +
Prev Next

#38

West Warwick

Students meeting or exceeding expectations: 

25.64%

View Larger +
Prev Next

#37

Segue Institute for Learning

Students meeting or exceeding expectations: 

27.23%

View Larger +
Prev Next

#36

Johnston

Students meeting or exceeding expectations: 

27.55%

View Larger +
Prev Next

#35

North Providence

Students meeting or exceeding expectations: 

29.05%

View Larger +
Prev Next

#34

East Providence

Students meeting or exceeding expectations: 

31.58%

View Larger +
Prev Next

#33

International Charter School

Students meeting or exceeding expectations: 

32.1%

View Larger +
Prev Next

#32

Middletown

Students meeting or exceeding expectations: 

34.43%

View Larger +
Prev Next

#31

Cranston

Students meeting or exceeding expectations: 

35.45%

View Larger +
Prev Next

#30

Foster

Students meeting or exceeding expectations: 

35.57%

View Larger +
Prev Next

#29

Warwick 

Students meeting or exceeding expectations: 

36.9%

View Larger +
Prev Next

#28

Tiverton

Students meeting or exceeding expectations: 

38.34%

View Larger +
Prev Next

#27

Scituate

Students meeting or exceeding expectations: 

38.55%

View Larger +
Prev Next

#26

Learning Community

Students meeting or exceeding expectations: 

39.08%

View Larger +
Prev Next

#25

Lincoln

Students meeting or exceeding expectations: 

39.94%

View Larger +
Prev Next

#24

Westerly

Students meeting or exceeding expectations: 

40.41%

View Larger +
Prev Next

#23

Exeter-West Greenwich

Students meeting or exceeding expectations: 

42.49%

View Larger +
Prev Next

#22

Foster-Glocester

Students meeting or exceeding expectations: 

43%

View Larger +
Prev Next

#21

Coventry

Students meeting or exceeding expectations: 

45.51%

View Larger +
Prev Next

#20

South Kingstown

Students meeting or exceeding expectations: 

46.44%

View Larger +
Prev Next

#19

Blackstone Valley Prep Mayoral Academy

Students meeting or exceeding expectations: 

45.6%

View Larger +
Prev Next

#18

The Hope Academy

Students meeting or exceeding expectations: 

47.22%

View Larger +
Prev Next

#17

Portsmouth

Students meeting or exceeding expectations: 

50.24%

View Larger +
Prev Next

#16

Bristol-Warren

Students meeting or exceeding expectations: 

51.29%

View Larger +
Prev Next

#15

Smithfield

Students meeting or exceeding expectations: 

51.99%

View Larger +
Prev Next

#14

Little Compton

Students meeting or exceeding expectations: 

52.8%

View Larger +
Prev Next

#13

Narragansett

Students meeting or exceeding expectations: 

54.22%

View Larger +
Prev Next

#12

North Kingstown

Students meeting or exceeding expectations: 

54.31%

View Larger +
Prev Next

#11

The Compass School

Students meeting or exceeding expectations: 

55.08%

View Larger +
Prev Next

#10

Cumberland

Students meeting or exceeding expectations: 

55.93%

View Larger +
Prev Next

#9

East Greenwich

Students meeting or exceeding expectations: 

56.21%

View Larger +
Prev Next

#8

Achievement First Rhode Island

Students meeting or exceeding expectations: 

56.5%

View Larger +
Prev Next

#7

Chariho

Students meeting or exceeding expectations: 

56.85%

View Larger +
Prev Next

#6

Jamestown

Students meeting or exceeding expectations: 

58.97%

View Larger +
Prev Next

#5

Glocester

Students meeting or exceeding expectations: 

59.86%

View Larger +
Prev Next

#4

North Smithfield

Students meeting or exceeding expectations: 

59.98%

View Larger +
Prev Next

#3

Barrington

Students meeting or exceeding expectations: 

69.46%

View Larger +
Prev Next

#2

New Shoreham

Students meeting or exceeding expectations: 

70%

View Larger +
Prev Next

#1

Kingston Hill Academy

Students meeting or exceeding expectations: 

71.13%


Enjoy this post? Share it with others.


Sign Up for the Daily Eblast

I want to follow on Twitter

I want to Like on Facebook