Guest MINDSETTER ™ Joel Hellman: Lessons Not Learned from PARCC
Wednesday, November 18, 2015
Guest MINDSETTER ™ Joel Hellman
I have raised a dozen teenagers in my home, biological, foster and adopted. Teenagers believe they are immortal, infallible, and are generally stubborn by nature. What I have found to be the turning point for each of them is when I finally at long last get them to say out loud 3 words: “I SCREWED UP”. Once they admit that they can make a mistake, own it, and move on, everything else becomes easier.
The PARCC tests came out today, and for anyone who has been following it here and across the country, the results were not much of a surprise. The results have been poor nationally, and as usual they are even worse in Rhode Island.
Again no surprise, but what does it really mean?
GET THE LATEST BREAKING NEWS HERE -- SIGN UP FOR GOLOCAL FREE DAILY EBLAST
Not much really. Barrington and East Greenwich did the best. Woonsocket, Central Falls, and Providence did the worst, showing as I have written before, that high stakes testing has much more to do with if you live in poverty, and stable homes than what material is being covered. It doesn’t mean that teachers are better in Barrington, or that students are generally smarter in East Greenwich. It shows more that if the family is not worried about where their next meal is coming from, they will do better on tests than those living under economic stress.
Let’s look at what the test didn’t do. First the test did not make anyone smarter. Since the test results were pretty much as projected, as every other measure before it showed, it did not provide any real new data that educators didn’t already know. These were things that RIDE and the US Department of Education were looking for, what the PARCC test would provide. It didn’t do any of that. It did not provide a useable standard to base graduations on. I mean are they going to Fail 19 out of 20 Central Falls students?
Setting the Standard Below Proficiency
Remember until the General Assembly acted last year, this was going to be a graduation requirement. If you are using proficiency as a standard than 9 out of 10 urban students would have no diploma. In Barrington and East Greenwich only 60% would get a diploma. Since both towns have 90% of students going to college, that is going to be bad news to 30% of the students. In the alternate the state could pick a lower arbitrary number to have the cut off for graduation.
So, since proficiency is not the standard, I believe the formula used to reach that number would read, "How many students do we want to fail” and pick a number. How would you like to be one point under that number?
Another problem is that it should be clear to everyone that PARCC cannot be used for teacher evaluations. As Robert Walsh pointed out last week on “Lively Experiment," each student comes with a history: What teacher they had in previous years, were those teachers better at math, LA, or science? Can you hold a teacher responsible for having a larger number of students who live in abject poverty or is being abused at home? How could you quantify that make it fair to teachers?
The same standard should be applied to students. How can you use the PARCC test to fail to graduate a student because a past teacher(s) have failed them? Or for teachers who are not good in one subject?
My wife got her teaching degree from Roger Williams. When she student taught to get her Master’s in Education, she was assigned to a 4th grade class. The teacher didn’t like math. It was his practice not to teach math at all. He just wouldn’t teach his classes math. This caused my wife some consternation, as part of her grade and certification was determined by creating math lessons. She commented on this to her instructor at Roger Williams, and the net result was the teacher still didn’t teach math and the district she student taught in wouldn’t give her an interview the next year. By complaining about a failing of a teacher she was labeled a “trouble maker”. The teacher of course stayed there doing the same thing year after year.
Do you suppose that say 10 years of 25 students, so those 250 students ever recovered from not having math for a year? Would PARCC show them as non-proficient for not having math knowledge? Would the low scores of the next year’s test hurt the next year’s teacher? Could it cost them their job or merit pay?
What about time stolen from Science, History or Foreign languages for the PARCC tests? Do they no longer matter? What about the Arts? And since 7 out of 8 non math teachers couldn’t pass the algebra part of the PARCC test anyway, why would we expect more out of our students? Barrington’s superintendent sent a letter to all parents out saying it was important to take the test now as most students will forget the Algebra in a year or two. Is the PARCC test evaluating education or the ability to regurgitate information and forget!
What about the cost? Nationwide we, the taxpayers, paid billions for this failed experiment. Millions buying computers and paying fees paid to Pearson, ( they are real winners of the Common Core and PARCC testing) a company owned to a significant degree by middle-eastern investors. But those are not the real costs. The real costs hare harder to quantify.
Questioning Common Core
If you look at the assignments of Common Core and how the students must answer them it is mind numbing. Online I saw a 3rd grader’s homework assignment that read “What is 5X3 and show your work”. The student answered 15 and showed 5+5+5. The teacher marked it wrong. The right answer was 15 3+3+3+3+3. That is just insane. That is how I sum up common core math.
And in the elementary grades elsewhere in the country, weeks were spent on studying Islam, how to pray in Arabic, what the 5 pillars of Islam are, and field trips to Mosques. I remember never being able to discuss the holy Trinity, or the details of Yom Kippur for separation of church. Why in Common Core is it OK to learn how to be a good Muslim? But in School it is not OK to learn to be a good Jew or Christian?
But the worst of it all is the lost education time. Last year, test prep, testing and recovery time took up 12% of learning time available. Shouldn’t education be more about learning than testing? If 12% of the time is going to this one test, what are they skipping?
The answer I found out at the high school open house. My daughter’s US history teacher explained to us parents that this year they were pretty much skipping the American Revolution because of time constraints. What is US history without the Declaration of Independence, or Valley Forge, or Lexington and Concord or Bunker Hill? No time for it. It’s not on the PARCC test. The only time difference between 2 Years ago and now is the PARCC testing.
So ultimately we need to call the PARCC test and Common Core what it is: a failure. It is time for Ride to learn the lessons I taught my teenagers. It is time for them to say “I SCREWED UP”. And just like my teenagers, You will forgive me if I will not be holding my breath while I wait.
Joel Hellmann, a Barrington RI resident is a foster and adoptive parent who fostered 22 students in his home. He is currently running for the Barrington School committee in a Dec 15 special election. He has served on the Barrington Committee on Appropriations, Charter Review committee, and is currently a director for the Bristol county Water Authority and the finance sub committee chair.
Related Slideshow: Depression Among High School Students: How Does Your Community Compare?
The below slides show the number of students who reported experiencing depression at least once in the past 12 months, based upon the SurveyWorks survey, which was offered to public high school students across the state in the spring of 2014. For those who said they had been depressed, the survey asked how many had considered suicide and how many had actually attempted it. Schools are listed based on depression rates, starting with the lowest to the highest. Note that the rates can be affected by how many students participate in the survey and how supportive a school environment is. Schools that were not full high schools are not included. Source: InfoWorks! data from the Rhode Island Department of Education.
 View Larger +
Prev
Next
#56 Block Island School
Location: New Shoreham
Number of Students: NA
Number of Student Respondents: 30
% Who Have Been Depressed: 16.7
Of those Who Have Been Depressed
% Who Considered Suicide: NA
% Who Attempted Suicide: NA
 View Larger +
Prev
Next
#55 Cranston Construction Career Academy
Location: Cranston
Number of Students: 158
Number of Student Respondents: 124
% Who Have Been Depressed: 19.4
Of those Who Have Been Depressed
% Who Considered Suicide: 8.1
% Who Attempted Suicide: 0.0
 View Larger +
Prev
Next
#54 Sheila Skip Nowell Leadership Academy (II)
Location: Providence
Number of Students: 81
Number of Student Respondents: 15
% Who Have Been Depressed: 20.0
Of those Who Have Been Depressed
% Who Considered Suicide: NA
% Who Attempted Suicide: NA
 View Larger +
Prev
Next
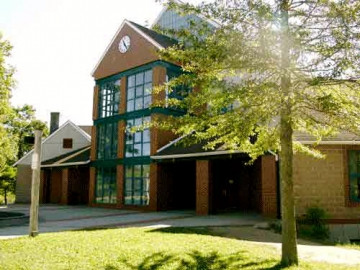
#53 Exeter/West Greenwich
Location: Exeter and West Greenwich
Number of Students: 540
Number of Student Respondents: 438
% Who Have Been Depressed: 20.1
Of those Who Have Been Depressed
% Who Considered Suicide: 9.1
% Who Attempted Suicide: 4.8
 View Larger +
Prev
Next
#52 North Smithfield High School
Location: North Smithfield
Number of Students: 519
Number of Student Respondents: 431
% Who Have Been Depressed: 21.8
Of those Who Have Been Depressed
% Who Considered Suicide: 7.9
% Who Attempted Suicide: 2.3
 View Larger +
Prev
Next
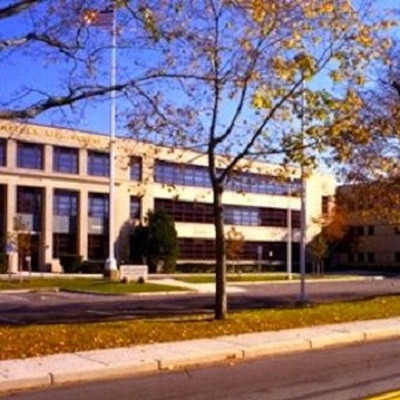
#51 South Kingstown High School
Location: South Kingstown
Number of Students: 1,073
Number of Student Respondents: 685
% Who Have Been Depressed: 22.3
Of those Who Have Been Depressed
% Who Considered Suicide: 10.8
% Who Attempted Suicide: 4.7
 View Larger +
Prev
Next
#50 Portsmouth High School
Location: Portsmouth
Number of Students: 960
Number of Student Respondents: 777
% Who Have Been Depressed: 22.4
Of those Who Have Been Depressed
% Who Considered Suicide: 10.6
% Who Attempted Suicide: 6.0
 View Larger +
Prev
Next
#49 Chariho Regional High School
Location: Charlestown
Number of Students: 1,201
Number of Student Respondents: 955
% Who Have Been Depressed: 23.7
Of those Who Have Been Depressed
% Who Considered Suicide: 10.2
% Who Attempted Suicide: 4.8
 View Larger +
Prev
Next
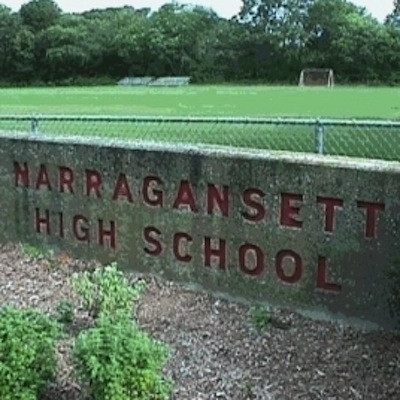
#48 Narragansett High School
Location: Narragansett
Number of Students: 429
Number of Student Respondents: 349
% Who Have Been Depressed: 23.8
Of those Who Have Been Depressed
% Who Considered Suicide: 11.2
% Who Attempted Suicide: 5.3
 View Larger +
Prev
Next
#47 Mount Pleasant High School
Location: Providence
Number of Students: 898
Number of Student Respondents: 656
% Who Have Been Depressed: 23.9
Of those Who Have Been Depressed
% Who Considered Suicide: 8.1
% Who Attempted Suicide: 4.5
 View Larger +
Prev
Next
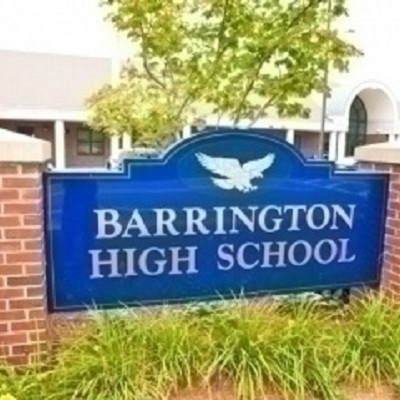
#46 Barrington High School
Location: Barrington
Number of Students: 1,027
Number of Student Respondents: 843
% Who Have Been Depressed: 24.0
Of those Who Have Been Depressed
% Who Considered Suicide: 9.6
% Who Attempted Suicide: 3.2
 View Larger +
Prev
Next
#45 Scituate High School
Location: Scituate
Number of Students: 469
Number of Student Respondents: 399
% Who Have Been Depressed: 24.1
Of those Who Have Been Depressed
% Who Considered Suicide: 8.2
% Who Attempted Suicide: 4.1
 View Larger +
Prev
Next
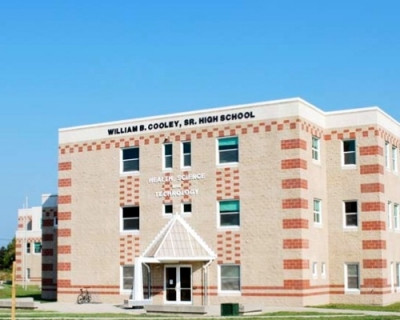
#44 William B. Cooley Senior High School
Location: Providence
Number of Students: 617
Number of Student Respondents: 376
% Who Have Been Depressed: 24.2
Of those Who Have Been Depressed
% Who Considered Suicide: 6.9
% Who Attempted Suicide: 4.8
 View Larger +
Prev
Next
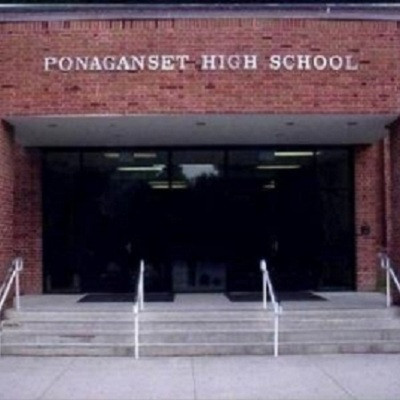
#43 Ponaganset High School
Location: Foster and Glocester
Number of Students: 684
Number of Student Respondents: 541
% Who Have Been Depressed: 24.4
Of those Who Have Been Depressed
% Who Considered Suicide: 11.2
% Who Attempted Suicide: 6.2
 View Larger +
Prev
Next
#42 East Greenwich High School
Location: East Greenwich
Number of Students: 729
Number of Student Respondents: 675
% Who Have Been Depressed: 24.6
Of those Who Have Been Depressed
% Who Considered Suicide: 9.7
% Who Attempted Suicide: 4.8
 View Larger +
Prev
Next
#41 Lincoln Senior High School
Location: Lincoln
Number of Students: 1,005
Number of Student Respondents: 771
% Who Have Been Depressed: 24.8
Of those Who Have Been Depressed
% Who Considered Suicide: 11.1
% Who Attempted Suicide: 5.1
 View Larger +
Prev
Next
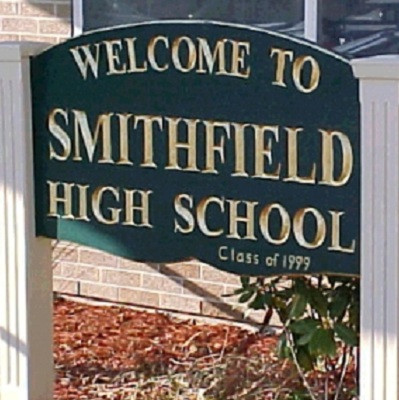
#40 Smithfield Senior High School
Location: Smithfield
Number of Students: 755
Number of Student Respondents: 499
% Who Have Been Depressed: 24.8
Of those Who Have Been Depressed
% Who Considered Suicide: 12.2
% Who Attempted Suicide: 7.3
 View Larger +
Prev
Next
#39 North Kingstown Senior High School
Location: North Kingstown
Number of Students: 1,387
Number of Student Respondents: 979
% Who Have Been Depressed: 25.0
Of those Who Have Been Depressed
% Who Considered Suicide: 10.4
% Who Attempted Suicide: 5.2
 View Larger +
Prev
Next
#38 Coventry High School
Location: Coventry
Number of Students: 1,607
Number of Student Respondents: 1,254
% Who Have Been Depressed: 25.8
Of those Who Have Been Depressed
% Who Considered Suicide: 11.6
% Who Attempted Suicide: 5.1
 View Larger +
Prev
Next
#37 Paul Cuffee Charter School
Location: Providence
Number of Students: NA
Number of Student Respondents: 205
% Who Have Been Depressed: 25.9
Of those Who Have Been Depressed
% Who Considered Suicide: 13.2
% Who Attempted Suicide: 5.4
 View Larger +
Prev
Next
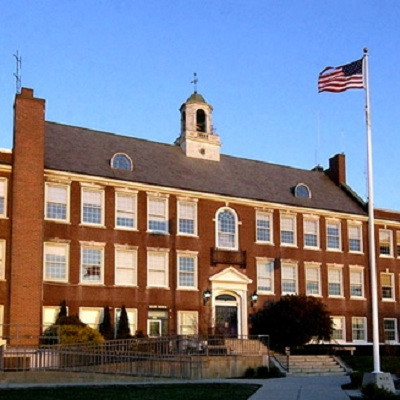
#36 West Warwick Senior High School
Location: West Warwick
Number of Students: 935
Number of Student Respondents: 628
% Who Have Been Depressed: 27.2
Of those Who Have Been Depressed
% Who Considered Suicide: 14.9
% Who Attempted Suicide: 7.1
 View Larger +
Prev
Next
#35 Westerly High School
Location: Westerly
Number of Students: 917
Number of Student Respondents: 662
% Who Have Been Depressed: 27.3
Of those Who Have Been Depressed
% Who Considered Suicide: 10.8
% Who Attempted Suicide: 5.6
 View Larger +
Prev
Next
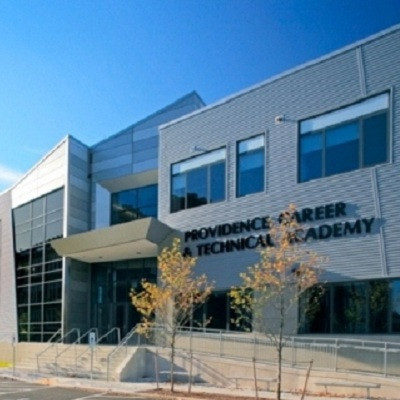
#34 Providence Career and Technical Academy
Location: Providence
Number of Students: 577
Number of Student Respondents: 424
% Who Have Been Depressed: 27.4
Of those Who Have Been Depressed
% Who Considered Suicide: 5.5
% Who Attempted Suicide: 3.4
 View Larger +
Prev
Next
#33 Toll Gate High School
Location: Warwick
Number of Students: 958
Number of Student Respondents: 684
% Who Have Been Depressed: 27.5
Of those Who Have Been Depressed
% Who Considered Suicide: 11.5
% Who Attempted Suicide: 5.9
 View Larger +
Prev
Next
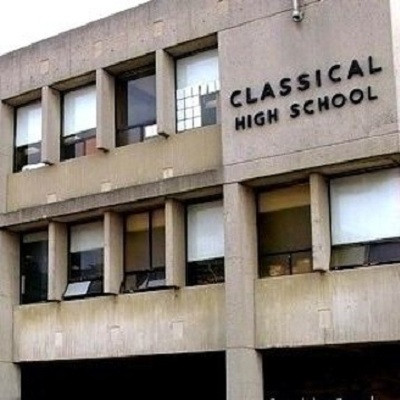
#32 Classical High School
Location: Providence
Number of Students: 1,119
Number of Student Respondents: 997
% Who Have Been Depressed: 27.7
Of those Who Have Been Depressed
% Who Considered Suicide: 8.8
% Who Attempted Suicide: 2.6
 View Larger +
Prev
Next
#31 Cumberland High School
Location: Cumberland
Number of Students: 1,337
Number of Student Respondents: 1,039
% Who Have Been Depressed: 27.8
Of those Who Have Been Depressed
% Who Considered Suicide: 12.0
% Who Attempted Suicide: 6.6
 View Larger +
Prev
Next
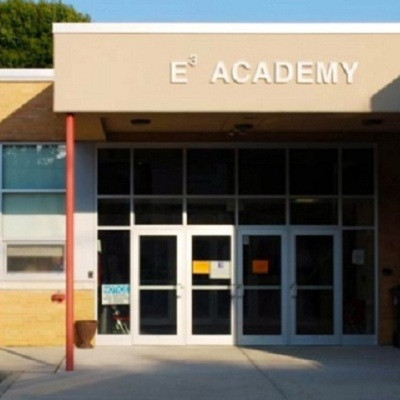
#30 E-Cubed Academy
Location: Providence
Number of Students: 349
Number of Student Respondents: 167
% Who Have Been Depressed: 28.1
Of those Who Have Been Depressed
% Who Considered Suicide: 12.5
% Who Attempted Suicide: 3.8
 View Larger +
Prev
Next
#29 Central Falls High School
Location: Central Falls
Number of Students: 727
Number of Student Respondents: 464
% Who Have Been Depressed: 28.4
Of those Who Have Been Depressed
% Who Considered Suicide: 11.9
% Who Attempted Suicide: 5.0
 View Larger +
Prev
Next
#28 Burrillville High School
Location: Burrillville
Number of Students: 682
Number of Student Respondents: 555
% Who Have Been Depressed: 28.8
Of those Who Have Been Depressed
% Who Considered Suicide: 11.6
% Who Attempted Suicide: 3.1
 View Larger +
Prev
Next
#27 Blackstone Charter Academy
Location: Pawtucket
Number of Students: 168
Number of Student Respondents: 146
% Who Have Been Depressed: 28.8
Of those Who Have Been Depressed
% Who Considered Suicide: 11.6
% Who Attempted Suicide: 4.1
 View Larger +
Prev
Next
#26 Cranston High School West
Location: Cranston
Number of Students: 1,526
Number of Student Respondents: 1,242
% Who Have Been Depressed: 29.2
Of those Who Have Been Depressed
% Who Considered Suicide: 13.6
% Who Attempted Suicide: 7.0
 View Larger +
Prev
Next
#25 Hope High School
Location: Providence
Number of Students: 894
Number of Student Respondents: 642
% Who Have Been Depressed: 29.4
Of those Who Have Been Depressed
% Who Considered Suicide: 11.3
% Who Attempted Suicide: 8.6
 View Larger +
Prev
Next
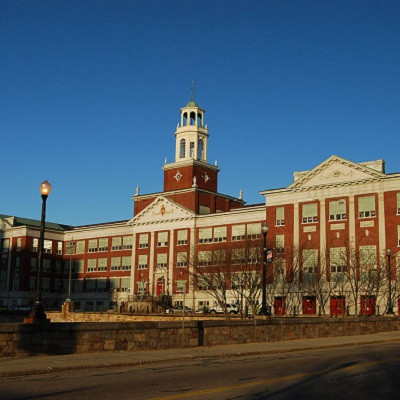
#24 Rogers High School
Location: Newport
Number of Students: 538
Number of Student Respondents: 390
% Who Have Been Depressed: 29.7
Of those Who Have Been Depressed
% Who Considered Suicide: 9.6
% Who Attempted Suicide: 4.5
 View Larger +
Prev
Next
#23 William E. Tolman Senior High School
Location: Pawtucket
Number of Students: 1,034
Number of Student Respondents: 563
% Who Have Been Depressed: 30.0
Of those Who Have Been Depressed
% Who Considered Suicide: 10.7
% Who Attempted Suicide: 4.9
 View Larger +
Prev
Next
#22 Shea Senior High School
Location: Pawtucket
Number of Students: 858
Number of Student Respondents: 593
% Who Have Been Depressed: 30.4
Of those Who Have Been Depressed
% Who Considered Suicide: 10.3
% Who Attempted Suicide: 7.0
 View Larger +
Prev
Next
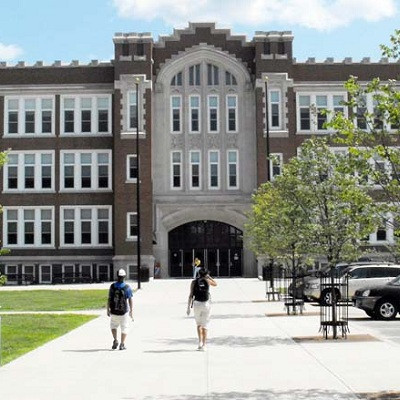
#21 Tiverton High School
Location: Tiverton
Number of Students: 541
Number of Student Respondents: 437
% Who Have Been Depressed: 30.4
Of those Who Have Been Depressed
% Who Considered Suicide: 11.8
% Who Attempted Suicide: 5.7
 View Larger +
Prev
Next
#20 Central High School
Location: Providence
Number of Students: 1,112
Number of Student Respondents: 700
% Who Have Been Depressed: 30.6
Of those Who Have Been Depressed
% Who Considered Suicide: 10.6
% Who Attempted Suicide: 6.3
 View Larger +
Prev
Next
#19 Mt. Hope High School
Location: Bristol
Number of Students: 990
Number of Student Respondents: 745
% Who Have Been Depressed: 31.0
Of those Who Have Been Depressed
% Who Considered Suicide: 13.8
% Who Attempted Suicide: 5.9
 View Larger +
Prev
Next
#18 Dr. Jorge Alvarez High School
Location: Providence
Number of Students: 486
Number of Student Respondents: 327
% Who Have Been Depressed: 31.2
Of those Who Have Been Depressed
% Who Considered Suicide: 8.3
% Who Attempted Suicide: 4.9
 View Larger +
Prev
Next
#17 North Providence High School
Location: North Providence
Number of Students: 969
Number of Student Respondents: 769
% Who Have Been Depressed: 31.7
Of those Who Have Been Depressed
% Who Considered Suicide: 14.3
% Who Attempted Suicide: 5.2
 View Larger +
Prev
Next
#16 Cranston High School East
Location: Cranston
Number of Students: 1,583
Number of Student Respondents: 1,317
% Who Have Been Depressed: 32.8
Of those Who Have Been Depressed
% Who Considered Suicide: 14.1
% Who Attempted Suicide: 6.7
 View Larger +
Prev
Next
#15 Academy for Career Exploration
Location: Providence
Number of Students: 168
Number of Student Respondents: 97
% Who Have Been Depressed: 33.0
Of those Who Have Been Depressed
% Who Considered Suicide: 12.4
% Who Attempted Suicide: 1.0
 View Larger +
Prev
Next
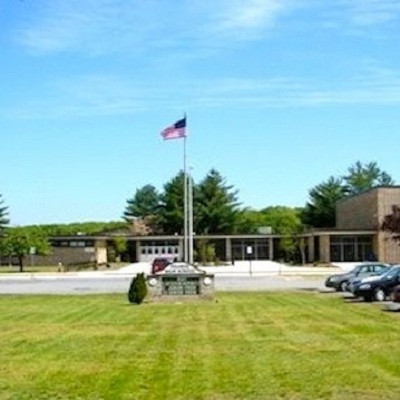
#14 Middletown High School
Location: Middletown
Number of Students: 685
Number of Student Respondents: 514
% Who Have Been Depressed: 33.3
Of those Who Have Been Depressed
% Who Considered Suicide: 11.7
% Who Attempted Suicide: 6.0
 View Larger +
Prev
Next
#13 Johnston Senior High School
Location: Johnston
Number of Students: 893
Number of Student Respondents: 659
% Who Have Been Depressed: 33.5
Of those Who Have Been Depressed
% Who Considered Suicide: 16.4
% Who Attempted Suicide: 7.6
 View Larger +
Prev
Next
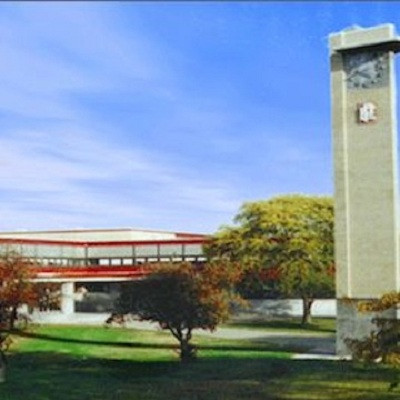
#12 Pilgrim High School
Location: Warwick
Number of Students: 991
Number of Student Respondents: 791
% Who Have Been Depressed: 33.5
Of those Who Have Been Depressed
% Who Considered Suicide: 16.1
% Who Attempted Suicide: 7.8
 View Larger +
Prev
Next
#11 East Providence High School
Location: East Providence
Number of Students: 1,502
Number of Student Respondents: 1,181
% Who Have Been Depressed: 33.8
Of those Who Have Been Depressed
% Who Considered Suicide: 14.6
% Who Attempted Suicide: 7.3
 View Larger +
Prev
Next
#10 Metropolitan Regional Career and Technical Center
Location: Providence
Number of Students: 838
Number of Student Respondents: 608
% Who Have Been Depressed: 34.4
Of those Who Have Been Depressed
% Who Considered Suicide: 15.4
% Who Attempted Suicide: 5.4
 View Larger +
Prev
Next
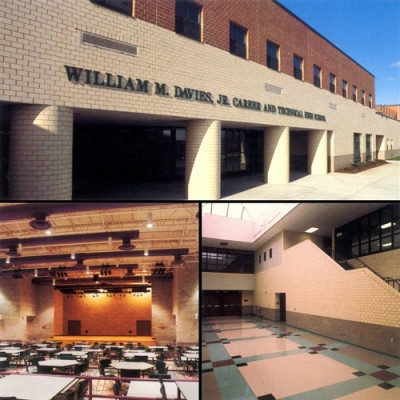
#9 William M. Davies Career & Technical Center
Location: Lincoln
Number of Students: 849
Number of Student Respondents: 702
% Who Have Been Depressed: 34.5
Of those Who Have Been Depressed
% Who Considered Suicide: 17.6
% Who Attempted Suicide: 7.0
 View Larger +
Prev
Next
#8 Warwick Veterans Memorial High School
Location: Warwick
Number of Students: 910
Number of Student Respondents: 629
% Who Have Been Depressed: 34.8
Of those Who Have Been Depressed
% Who Considered Suicide: 16.3
% Who Attempted Suicide: 7.8
 View Larger +
Prev
Next
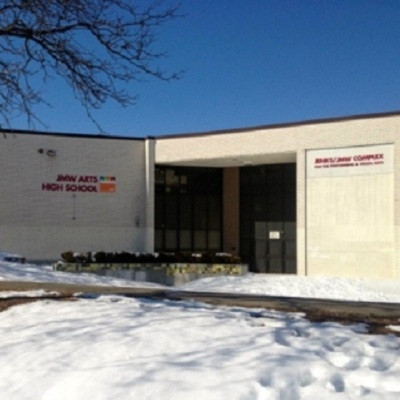
#7 The Greene School
Location: Exeter
Number of Students: 162
Number of Student Respondents: 138
% Who Have Been Depressed: 35.5
Of those Who Have Been Depressed
% Who Considered Suicide: 16.7
% Who Attempted Suicide: 7.2
 View Larger +
Prev
Next
#6 J.M. Walsh School
Location: Pawtucket
Number of Students: 192
Number of Student Respondents: 172
% Who Have Been Depressed: 36.6
Of those Who Have Been Depressed
% Who Considered Suicide: 17.4
% Who Attempted Suicide: 6.4
 View Larger +
Prev
Next
#5 Times2 Academy
Location: Providence
Number of Students: NA
Number of Student Respondents: 35
% Who Have Been Depressed: 37.1
Of those Who Have Been Depressed
% Who Considered Suicide: 17.1
% Who Attempted Suicide: 5.7
 View Larger +
Prev
Next
#4 Woonsocket High School
Location: Woonsocket
Number of Students: 1,579
Number of Student Respondents: 1,026
% Who Have Been Depressed: 37.3
Of those Who Have Been Depressed
% Who Considered Suicide: 17.0
% Who Attempted Suicide: 9.3
 View Larger +
Prev
Next
#3 RI Nurses Institute
Location: Providence
Number of Students: 266
Number of Student Respondents: 193
% Who Have Been Depressed: 38.9
Of those Who Have Been Depressed
% Who Considered Suicide: 10.9
% Who Attempted Suicide: 5.2
 View Larger +
Prev
Next
#2 Sheila Skip Nowell Leadership Academy (I)
Location: Central Falls
Number of Students: 73
Number of Student Respondents: 25
% Who Have Been Depressed: 40.0
Of those Who Have Been Depressed
% Who Considered Suicide: 12.0
% Who Attempted Suicide: 12.0
 View Larger +
Prev
Next
#1 Beacon Charter High School for the Arts
Location: Woonsocket
Number of Students: 227
Number of Student Respondents: 209
% Who Have Been Depressed: 41.1
Of those Who Have Been Depressed
% Who Considered Suicide: 27.9
% Who Attempted Suicide: 12.2
Related Articles
Enjoy this post? Share it with others.


