

Rhode Island's Most and Least Popular Politicians
Kate Nagle, GoLocal Contributor
Rhode Island's Most and Least Popular Politicians
"Job approval numbers are important to most elected officials. Some times it's the only measurement they really have as to whether voters think that they are doing a good job," said Jennifer Duffy with the Cook Political Report. "No politician can be proud of a 4.5 percent "excellent" job approval score."
Now that the 2013 elections are past -- and candidates have already begun to declare their intentions for 2014 races -- GoLocal takes a look at who have been the least and most popular elected officials in Rhode Island, looking at current and historic data from Brown University polls.
GET THE LATEST BREAKING NEWS HERE -- SIGN UP FOR GOLOCAL FREE DAILY EBLASTSee Past and Current Approval Ratings For Rhode Island Elected Officials BELOW
Marion Orr, Director of the A. Alfred Taubman Center for Public Policy and American Institutions and the Fred Lippitt Professor of Public Policy, Political Science and Urban Studies at Brown University, offered his thoughts on this year's numbers.
"As far as our federal delegation is concerned, I suspect it's a reflection of the discontent folks have currently with the institution of government, that the President and Congress can't get their act together. And that perception has a chilling effect on federal elected officials."
Regarding Governor Chafee's approval rating slip to 23%, Orr said, "I think this instance is a mix of people's perception of what might be called Chafee's "under-performance". I think in the case of the Governor, there's clearly some discontent on the unemployment, stagnant economy."
Darrell West with the Brookings Institution had a similar assessment of the factors that played a part in approval ratings. "When numbers go down across the board, there generally is a systemic reason as opposed to an assessment of individual performances. That could be feelings about government in general or how voters feel about top political leaders."
Duffy thought the President's numbers were particularly noteworthy.
"I suspect that the drop in approval ratings has much more to do with voters' frustrations about the economy, jobs, health care and the government shut down than it does about any particular elected official. Just about everyone's number dropped about the same number of points, except Obama's. It's amazing to me that his job approval rating is 41 percent in a state he carried just a year ago with 63 percent of the vote."
Importance to Elected Officials
Orr added, "If you're an incumbent, you want high approval ratings to ward off challengers to keep coming your way. If you're putting good numbers up, challengers might not risk leaving their current position to run against someone with high approval ratings."
"They always matter to the officeholders but because they can be affected by external conditions, such as a government shutdown, or a great stock market, officeholders worry more about their ratings the closer they are to Election Day," said Brown Professor of Political Science Approval Wendy Schiller.
"As for the differences between Senator Reed and Whitehouse, frequently the senior senator in a state is more popular than their junior colleague, even when they are nearly identical in their voting records. Overall, all of Congress suffered at the time of this poll because of the government shutdown, and it will take a long time for Congress as a whole to recover in terms of its reputation, especially if it happens again."
Cautionary Advice
Veteran political pollster Victor Profughi warned about relying on a single vantage point for an assessment of an elected official's performance -- and public approval.
"I think I would make a distinction between the Brown poll, and polls in general -- there's a lot of attention to them, for sure. If a candidate is running for re-election, their first question is usually, "How am I doing with my job ratings," said Profughi.
He continued, "It's still very early to tell -- those ratings are as much a reflection of a sentiment more than anything. I don't know what effect they'll have. The fact that the approval scores are going to down is not likely to affect the voters choice -- how they feel about a candidate will affect their voters."
June Sager Speakman, Ph.D., who is a Professor of Political Science at Roger Williams University, said "Approval ratings are less important to candidates than polls that accurately measure likely voter behavior. But because approval ratings get so much press attention, and thus do influence the atmosphere within which the campaign takes place, candidates would rather see high numbers than low ones, obviously. And as you know, candidates have internal polls done by professional polling firms using state-of-the-art methods, that the candidates rely on the tweak their message, or their schedule, or their general campaign strategy."
RIC Professor Valerie Endress thought that poll numbers should be taken with a grain of salt -- but that they could be advantageous, as well.
"Polls can influence voters, but usually not enough to change the outcome. Studies indicate that holding a lead, combined with high approval ratings can mean perhaps a four or five percentage-point bump among undecided voters. The effect can be more in a primary, particularly when the opponents are not well known. Where the greatest impact may be felt is in fundraising. Individuals are much more likely to give to frontrunners, so a candidate lagging in the race and with high negatives won’t reap the same rewards in fundraising efforts."
Impact on Voters?
Orr offered his take on the impact of the ratings. "There's public opinion, versus "who I'm going to vote for." For one, when you ask public approval, you're not asking for "either/or" - in an election you get a different set of circumstances.
Orr pointed to the example of Congressman David Cicilline. "David had low public approval ratings, but as he's running in Rhode Island in the 1st congressional district against a Republican, his chances of winning are still significant, based on party affiliation alone."
RIC's Endress cautioned as well that next year's election is still a year out. "At this early stage, campaign operatives are not going to make significant adjustments in the way that they frame a campaign because of early ratings. They’re more interested in upward and downward trends over time as the campaign evolves and the public has had more exposure to all of the candidates."
See Rhode Island Politician Approval Ratings BELOW
Rhode Island's Most and Least Popular Politicians

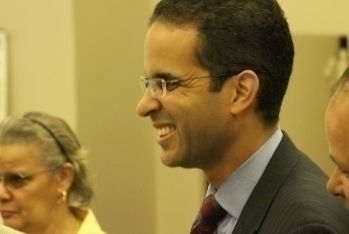
Mayor Angel Taveras
October 2013: 63.9%
October 2012: 65.6%
December 2011: 51.7%

Treasurer Gina Raimondo
October 2013: 54.2%
October 2012: 58.7%
December 2011: 52%

Senator Jack Reed
October 2013: 51.6%
October 2012: 58.5%
December 2011: 46.4%
July 2010: 55.6%
December 2009: 56.3%
September 2008: 68%
September 2007: 61%
September 2006: 70%
September 2005: 65%
June 2004: 63%
September 2003: 62%

Sen. Sheldon Whitehouse
October 2013: 39.4%
October 2012: 45.4%
December 2011: 33.6%
July 2010: 42.8%
December 2009: 43.7%
September 2008: 46.2%
September 2007: 41%

Rep. Jim Langevin
October 2013: 38.7%
October 2012: 41%
December 2011: 41.9%
July 2010: 54.6%
December 2009: 46%
September 2008: 51.2%
September 2007: 55%
September 2006: 56%
September 2005: 62%
June 2004: 56%
September 2003: 56%

AG Peter Kilmartin
October 2013: 35.6%
October 2012: 35.8%
December 2011: 34.5%
July 2010: 20.2%

Sec. of State Mollis
October 2013: 35.6%
October 2012: 28.6%
December 2011: 25.6%
July 2010: 32.6%
December 2009: 22.6%
September 2008: 24.1%
September 2007: 23%

Lt. Governor Roberts
October 2013: 32.9%
October 2012: 37.5%
December 2011: 32.8%
July 2010: 33.5%
December 2009: 22.4%
September 2008: 24%
September 2007: 37%

Rep. David Cicilline
October 2013: 26.6%
October 2012: 29.7%
December 2011: 24.3%
*July 2010: 40.3%
*December 2009: 40.8%
*September 2008: 46%
*September 2007: 64%
*September 2006: 58%
*September 2005: 60%
*June 2004: 61%
*September 2003: 67%
* As Mayor of Providence

Sen. President Paiva-Weed
October 2013: 23.5%
October 2012: 26.2%
December 2011: 24.1%
July 2010: 21.4%
December 2009: 19%

Governor Lincoln Chafee
October 2013: 23%
October 2012: 28.5%
December 2011: 27.4%
*September 2006: 51%
*September 2005: 54%
*June 2004: 56%
*September 2003: 50%
* As U.S. Senator

Speaker Fox
October 2013: 20.5%
October 2012: 18.3%
December 2011: 25.9%
July 2010: 20.2%


