RI Trails Most of New England in Developing Patents and Local Colleges Lag Their Peers
Tuesday, January 22, 2019
GoLocalProv Business Team
 View Larger +
RI ranks 24th
Rhode Island is quite average for developing patents per capita in America -- ranked 24th in the country, but in New England, it ranks only above Maine for developing intellectual property.
By contrast, per capita, Massachusetts not only ranks second only to California in the country in developing patents, but some of its top universities are among the tops in the world for creating new innovation and technology.
SEE STATE RANKINGS BELOW
GET THE LATEST BREAKING NEWS HERE -- SIGN UP FOR GOLOCAL FREE DAILY EBLAST
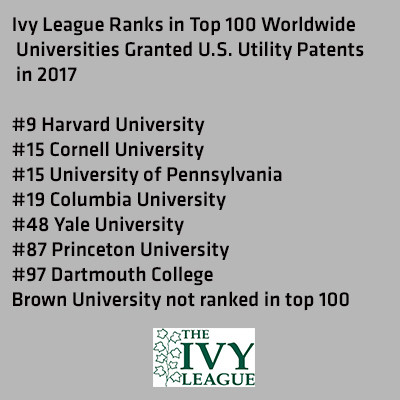
Massachusetts Institute of Technology generated 306 U.S. Utility Patents in 2017, which was second most of the U.S. universities ranked -- only the University of California earned more.
Harvard University ranked 9th with 156, and Tuft University was ranked 70th and was granted 37 patents.
Brown and URI Lag Peers
Brown University had 18 U.S. patents in 2017 and “11 as of November 2018 -- we may have received one more in December,” according to Brian Clark, Director of News and Editorial Development at Brown University.
Brown’s spokesperson was first to say that the University has significant work to do.
“Speaking more broadly, I'd say that research at Brown has the potential to add to the state’s innovation output, but it is not commercialized at the scale we'd like to see,” said Clark.
“While there are scholars interested in exploring the commercial potential of their work, they often lack the professional incentives and the business training to pursue commercial opportunities. This is definitely an area where we're taking steps to grow,” he added.
At the University of Rhode Island, only two patents were granted to university-affiliated research in 2017. According to URI data, the College of Engineering at URI has not been granted a patent since 2014.
Of the top 20 universities in the world by patents granted in 2017, nine of them were public universities in the United States or affiliated. “The institutions on this list are doing incredible work promoting academic innovation and incubating groundbreaking technologies which exemplify the importance of technology transfer to institutional success," said Paul R. Sanberg, president of the National Academy of Inventors.
Focus at Brown to Improve the Commercialization of IP
Brown was not ranked in the top 100 universities. Harvard, Cornell, Penn, and Columbia were all ranked in the top 20 patent granted universities -- and Brown is making an effort to transform its effort to commercialize its technology.
“Daniel Behr was hired at Brown in June 2017 to re-engineer our tech transfer efforts. His office's recent efforts include an expansion of Brown Biomedical Innovation Inc. (BBII), which helps biomedical research projects to bridge “valley of death” — the gap between when the National Institutes of Health stops funding research and when private investors are willing to step up,” said Clark.
“BBII recently established an $8.2 million fund to develop new technologies and hired a former biotech entrepreneur as managing director. Already, BBII has 26 preliminary requests for development funding,” added Clark.
Brown is also transforming how it does business with partners in developing technology. “The goal is for Brown to become a more user-friendly partner to industry, moving away from the transactional approaches that prevail in many university technology transfer offices.”
But, while Brown is working to transform its IP capacity, there is little transformation in the rest of Rhode Island — in academic, healthcare or business segments. On the top 50 companies in the world for IP, not of them had a significant presence located in RI.
Related Slideshow: Patents by States—See Who Is the Most Innovative
 View Larger +
Prev
Next
51.
State: DISTRICT OF COLUMBIA
2000 Population: N/A
2000 Utility Patent Count: N/A
2015 Population: N/A
2015 Utility Patent Count: N/A
2000 Patents per 1000 People: N/A
2015 Patents per 1000 People: N/A
Patents per Capita Growth Rate: 0.0%
Average Patents per 1000 People: N/A
 View Larger +
Prev
Next
50.
State: MISSISSIPPI
2000 Population: 2,848,353
2000 Utility Patent Count: 184
2015 Population: 2,989,390
2015 Utility Patent Count: 138
2000 Patents per 1000 People: 0.0646
2015 Patents per 1000 People: 0.0462
Patents per Capita Growth Rate: -28.5%
Average Patents per 1000 People: 0.0490
 View Larger +
Prev
Next
49.
State: ALASKA
2000 Population: 627,963
2000 Utility Patent Count: 43
2015 Population: 737,709
2015 Utility Patent Count: 40
2000 Patents per 1000 People: 0.0685
2015 Patents per 1000 People: 0.0542
Patents per Capita Growth Rate: -20.9%
Average Patents per 1000 People: 0.0529
 View Larger +
Prev
Next
48.
State: WEST VIRGINIA
2000 Population: 1,807,021
2000 Utility Patent Count: 145
2015 Population: 1,841,053
2015 Utility Patent Count: 127
2000 Patents per 1000 People: 0.0802
2015 Patents per 1000 People: 0.0690
Patents per Capita Growth Rate: -14.0%
Average Patents per 1000 People: 0.0649
 View Larger +
Prev
Next
47.
State: ARKANSAS
2000 Population: 2,678,588
2000 Utility Patent Count: 214
2015 Population: 2,977,853
2015 Utility Patent Count: 233
2000 Patents per 1000 People: 0.0799
2015 Patents per 1000 People: 0.0782
Patents per Capita Growth Rate: -2.1%
Average Patents per 1000 People: 0.0550
 View Larger +
Prev
Next
46.
State: LOUISIANA
2000 Population: 4,471,885
2000 Utility Patent Count: 518
2015 Population: 4,668,960
2015 Utility Patent Count: 399
2000 Patents per 1000 People: 0.1158
2015 Patents per 1000 People: 0.0855
Patents per Capita Growth Rate: -26.2%
Average Patents per 1000 People: 0.0799
 View Larger +
Prev
Next
45.
State: HAWAII
2000 Population: 1,213,519
2000 Utility Patent Count: 77
2015 Population: 1,425,157
2015 Utility Patent Count: 127
2000 Patents per 1000 People: 0.0635
2015 Patents per 1000 People: 0.0891
Patents per Capita Growth Rate: 40.3%
Average Patents per 1000 People: 0.0684
 View Larger +
Prev
Next
44.
State: ALABAMA
2000 Population: 4,452,173
2000 Utility Patent Count: 337
2015 Population: 4,853,875
2015 Utility Patent Count: 473
2000 Patents per 1000 People: 0.0757
2015 Patents per 1000 People: 0.0974
Patents per Capita Growth Rate: 28.7%
Average Patents per 1000 People: 0.0819
 View Larger +
Prev
Next
43.
State: SOUTH DAKOTA
2000 Population: 755,844
2000 Utility Patent Count: 86
2015 Population: 857,919
2015 Utility Patent Count: 113
2000 Patents per 1000 People: 0.1138
2015 Patents per 1000 People: 0.1317
Patents per Capita Growth Rate: 15.7%
Average Patents per 1000 People: 0.1039
 View Larger +
Prev
Next
42.
State: OKLAHOMA
2000 Population: 3,454,365
2000 Utility Patent Count: 542
2015 Population: 3,907,414
2015 Utility Patent Count: 532
2000 Patents per 1000 People: 0.1569
2015 Patents per 1000 People: 0.1362
Patents per Capita Growth Rate: -13.2%
Average Patents per 1000 People: 0.1351
 View Larger +
Prev
Next
41.
State: MONTANA
2000 Population: 903,773
2000 Utility Patent Count: 113
2015 Population: 1,032,073
2015 Utility Patent Count: 142
2000 Patents per 1000 People: 0.1250
2015 Patents per 1000 People: 0.1376
Patents per Capita Growth Rate: 10.1%
Average Patents per 1000 People: 0.1187
 View Larger +
Prev
Next
40.
State: KENTUCKY
2000 Population: 4,049,021
2000 Utility Patent Count: 458
2015 Population: 4,424,611
2015 Utility Patent Count: 663
2000 Patents per 1000 People: 0.1131
2015 Patents per 1000 People: 0.1498
Patents per Capita Growth Rate: 32.4%
Average Patents per 1000 People: 0.1119
 View Larger +
Prev
Next
39.
State: MAINE
2000 Population: 1,277,072
2000 Utility Patent Count: 127
2015 Population: 1,329,453
2015 Utility Patent Count: 201
2000 Patents per 1000 People: 0.0994
2015 Patents per 1000 People: 0.1512
Patents per Capita Growth Rate: 52.1%
Average Patents per 1000 People: 0.1230
 View Larger +
Prev
Next
38.
State: TENNESSEE
2000 Population: 5,703,719
2000 Utility Patent Count: 782
2015 Population: 6,595,056
2015 Utility Patent Count: 1,009
2000 Patents per 1000 People: 0.1371
2015 Patents per 1000 People: 0.1530
Patents per Capita Growth Rate: 11.6%
Average Patents per 1000 People: 0.1305
 View Larger +
Prev
Next
37.
State: NORTH DAKOTA
2000 Population: 642,023
2000 Utility Patent Count: 85
2015 Population: 756,835
2015 Utility Patent Count: 118
2000 Patents per 1000 People: 0.1324
2015 Patents per 1000 People: 0.1559
Patents per Capita Growth Rate: 17.7%
Average Patents per 1000 People: 0.1247
 View Larger +
Prev
Next
36.
State: NEBRASKA
2000 Population: 1,713,820
2000 Utility Patent Count: 231
2015 Population: 1,893,765
2015 Utility Patent Count: 313
2000 Patents per 1000 People: 0.1348
2015 Patents per 1000 People: 0.1653
Patents per Capita Growth Rate: 22.6%
Average Patents per 1000 People: 0.1277
 View Larger +
Prev
Next
35.
State: MISSOURI
2000 Population: 5,607,285
2000 Utility Patent Count: 822
2015 Population: 6,076,204
2015 Utility Patent Count: 1,082
2000 Patents per 1000 People: 0.1466
2015 Patents per 1000 People: 0.1781
Patents per Capita Growth Rate: 21.5%
Average Patents per 1000 People: 0.1471
 View Larger +
Prev
Next
34.
State: WYOMING
2000 Population: 494,300
2000 Utility Patent Count: 55
2015 Population: 586,555
2015 Utility Patent Count: 110
2000 Patents per 1000 People: 0.1113
2015 Patents per 1000 People: 0.1875
Patents per Capita Growth Rate: 68.5%
Average Patents per 1000 People: 0.1298
 View Larger +
Prev
Next
33.
State: SOUTH CAROLINA
2000 Population: 4,024,223
2000 Utility Patent Count: 531
2015 Population: 4,894,834
2015 Utility Patent Count: 950
2000 Patents per 1000 People: 0.1320
2015 Patents per 1000 People: 0.1941
Patents per Capita Growth Rate: 47.0%
Average Patents per 1000 People: 0.1372
 View Larger +
Prev
Next
32.
State: FLORIDA
2000 Population: 16,047,515
2000 Utility Patent Count: 2,605
2015 Population: 20,244,914
2015 Utility Patent Count: 4,054
2000 Patents per 1000 People: 0.1623
2015 Patents per 1000 People: 0.2002
Patents per Capita Growth Rate: 23.4%
Average Patents per 1000 People: 0.1571
 View Larger +
Prev
Next
31.
State: NEW MEXICO
2000 Population: 1,821,204
2000 Utility Patent Count: 323
2015 Population: 2,080,328
2015 Utility Patent Count: 427
2000 Patents per 1000 People: 0.1774
2015 Patents per 1000 People: 0.2053
Patents per Capita Growth Rate: 15.7%
Average Patents per 1000 People: 0.1842
 View Larger +
Prev
Next
30.
State: GEORGIA
2000 Population: 8,227,303
2000 Utility Patent Count: 1,312
2015 Population: 10,199,398
2015 Utility Patent Count: 2,465
2000 Patents per 1000 People: 0.1595
2015 Patents per 1000 People: 0.2417
Patents per Capita Growth Rate: 51.5%
Average Patents per 1000 People: 0.1795
 View Larger +
Prev
Next
29.
State: VIRGINIA
2000 Population: 7,105,817
2000 Utility Patent Count: 1,141
2015 Population: 8,367,587
2015 Utility Patent Count: 2,057
2000 Patents per 1000 People: 0.1606
2015 Patents per 1000 People: 0.2458
Patents per Capita Growth Rate: 53.1%
Average Patents per 1000 People: 0.1724
 View Larger +
Prev
Next
28.
State: NEVADA
2000 Population: 2,018,741
2000 Utility Patent Count: 316
2015 Population: 2,883,758
2015 Utility Patent Count: 725
2000 Patents per 1000 People: 0.1565
2015 Patents per 1000 People: 0.2514
Patents per Capita Growth Rate: 60.6%
Average Patents per 1000 People: 0.1898
 View Larger +
Prev
Next
27.
State: PENNSYLVANIA
2000 Population: 12,284,173
2000 Utility Patent Count: 3,640
2015 Population: 12,791,904
2015 Utility Patent Count: 3,825
2000 Patents per 1000 People: 0.2963
2015 Patents per 1000 People: 0.2990
Patents per Capita Growth Rate: 0.9%
Average Patents per 1000 People: 0.2546
 View Larger +
Prev
Next
26.
State: MARYLAND
2000 Population: 5,311,034
2000 Utility Patent Count: 1,358
2015 Population: 5,994,983
2015 Utility Patent Count: 1,838
2000 Patents per 1000 People: 0.2557
2015 Patents per 1000 People: 0.3066
Patents per Capita Growth Rate: 19.9%
Average Patents per 1000 People: 0.2587
 View Larger +
Prev
Next
25.
State: RHODE ISLAND
2000 Population: 1,050,268
2000 Utility Patent Count: 320
2015 Population: 1,055,607
2015 Utility Patent Count: 324
2000 Patents per 1000 People: 0.3047
2015 Patents per 1000 People: 0.3069
Patents per Capita Growth Rate: 0.7%
Average Patents per 1000 People: 0.2719
 View Larger +
Prev
Next
24.
State: INDIANA
2000 Population: 6,091,866
2000 Utility Patent Count: 1,429
2015 Population: 6,612,768
2015 Utility Patent Count: 2,033
2000 Patents per 1000 People: 0.2346
2015 Patents per 1000 People: 0.3074
Patents per Capita Growth Rate: 31.0%
Average Patents per 1000 People: 0.2250
 View Larger +
Prev
Next
23.
State: OHIO
2000 Population: 11,363,543
2000 Utility Patent Count: 3,197
2015 Population: 11,605,090
2015 Utility Patent Count: 3,590
2000 Patents per 1000 People: 0.2813
2015 Patents per 1000 People: 0.3093
Patents per Capita Growth Rate: 10.0%
Average Patents per 1000 People: 0.2635
 View Larger +
Prev
Next
22.
State: KANSAS
2000 Population: 2,693,681
2000 Utility Patent Count: 391
2015 Population: 2,906,721
2015 Utility Patent Count: 915
2000 Patents per 1000 People: 0.1452
2015 Patents per 1000 People: 0.3148
Patents per Capita Growth Rate: 116.8%
Average Patents per 1000 People: 0.2073
 View Larger +
Prev
Next
21.
State: IOWA
2000 Population: 2,929,067
2000 Utility Patent Count: 589
2015 Population: 3,121,997
2015 Utility Patent Count: 992
2000 Patents per 1000 People: 0.2011
2015 Patents per 1000 People: 0.3177
Patents per Capita Growth Rate: 58.0%
Average Patents per 1000 People: 0.2421
 View Larger +
Prev
Next
20.
State: NORTH CAROLINA
2000 Population: 8,081,614
2000 Utility Patent Count: 1,845
2015 Population: 10,035,186
2015 Utility Patent Count: 3,354
2000 Patents per 1000 People: 0.2283
2015 Patents per 1000 People: 0.3342
Patents per Capita Growth Rate: 46.4%
Average Patents per 1000 People: 0.2482
 View Larger +
Prev
Next
19.
State: WISCONSIN
2000 Population: 5,373,999
2000 Utility Patent Count: 1,686
2015 Population: 5,767,891
2015 Utility Patent Count: 2,039
2000 Patents per 1000 People: 0.3137
2015 Patents per 1000 People: 0.3535
Patents per Capita Growth Rate: 12.7%
Average Patents per 1000 People: 0.3099
 View Larger +
Prev
Next
18.
State: TEXAS
2000 Population: 20,944,499
2000 Utility Patent Count: 6,322
2015 Population: 27,429,639
2015 Utility Patent Count: 9,934
2000 Patents per 1000 People: 0.3018
2015 Patents per 1000 People: 0.3622
Patents per Capita Growth Rate: 20.0%
Average Patents per 1000 People: 0.2894
 View Larger +
Prev
Next
17.
State: ARIZONA
2000 Population: 5,160,586
2000 Utility Patent Count: 1,595
2015 Population: 6,817,565
2015 Utility Patent Count: 2,540
2000 Patents per 1000 People: 0.3091
2015 Patents per 1000 People: 0.3726
Patents per Capita Growth Rate: 20.5%
Average Patents per 1000 People: 0.3001
 View Larger +
Prev
Next
16.
State: DELAWARE
2000 Population: 786,373
2000 Utility Patent Count: 395
2015 Population: 944,076
2015 Utility Patent Count: 361
2000 Patents per 1000 People: 0.5023
2015 Patents per 1000 People: 0.3824
Patents per Capita Growth Rate: -23.9%
Average Patents per 1000 People: 0.4274
 View Larger +
Prev
Next
15.
State: ILLINOIS
2000 Population: 12,434,161
2000 Utility Patent Count: 3,832
2015 Population: 12,839,047
2015 Utility Patent Count: 5,028
2000 Patents per 1000 People: 0.3082
2015 Patents per 1000 People: 0.3916
Patents per Capita Growth Rate: 27.1%
Average Patents per 1000 People: 0.2876
 View Larger +
Prev
Next
14.
State: NEW YORK
2000 Population: 19,001,780
2000 Utility Patent Count: 6,086
2015 Population: 19,747,183
2015 Utility Patent Count: 8,464
2000 Patents per 1000 People: 0.3203
2015 Patents per 1000 People: 0.4286
Patents per Capita Growth Rate: 33.8%
Average Patents per 1000 People: 0.3353
 View Larger +
Prev
Next
13.
State: UTAH
2000 Population: 2,244,502
2000 Utility Patent Count: 709
2015 Population: 2,990,632
2015 Utility Patent Count: 1,404
2000 Patents per 1000 People: 0.3159
2015 Patents per 1000 People: 0.4695
Patents per Capita Growth Rate: 48.6%
Average Patents per 1000 People: 0.3282
 View Larger +
Prev
Next
12.
State: NEW JERSEY
2000 Population: 8,430,621
2000 Utility Patent Count: 3,886
2015 Population: 8,935,421
2015 Utility Patent Count: 4,602
2000 Patents per 1000 People: 0.4609
2015 Patents per 1000 People: 0.5150
Patents per Capita Growth Rate: 11.7%
Average Patents per 1000 People: 0.4173
 View Larger +
Prev
Next
11.
State: IDAHO
2000 Population: 1,299,430
2000 Utility Patent Count: 1,572
2015 Population: 1,652,828
2015 Utility Patent Count: 865
2000 Patents per 1000 People: 1.2098
2015 Patents per 1000 People: 0.5233
Patents per Capita Growth Rate: -56.7%
Average Patents per 1000 People: 0.9135
 View Larger +
Prev
Next
10.
State: COLORADO
2000 Population: 4,326,921
2000 Utility Patent Count: 1,848
2015 Population: 5,448,819
2015 Utility Patent Count: 3,045
2000 Patents per 1000 People: 0.4271
2015 Patents per 1000 People: 0.5588
Patents per Capita Growth Rate: 30.8%
Average Patents per 1000 People: 0.4429
 View Larger +
Prev
Next
9.
State: MICHIGAN
2000 Population: 9,952,450
2000 Utility Patent Count: 3,724
2015 Population: 9,917,715
2015 Utility Patent Count: 5,561
2000 Patents per 1000 People: 0.3742
2015 Patents per 1000 People: 0.5607
Patents per Capita Growth Rate: 49.8%
Average Patents per 1000 People: 0.3997
 View Larger +
Prev
Next
8.
State: OREGON
2000 Population: 3,429,708
2000 Utility Patent Count: 1,194
2015 Population: 4,024,634
2015 Utility Patent Count: 2,366
2000 Patents per 1000 People: 0.3481
2015 Patents per 1000 People: 0.5879
Patents per Capita Growth Rate: 68.9%
Average Patents per 1000 People: 0.4902
 View Larger +
Prev
Next
7.
State: CONNECTICUT
2000 Population: 3,411,777
2000 Utility Patent Count: 1,825
2015 Population: 3,584,730
2015 Utility Patent Count: 2,158
2000 Patents per 1000 People: 0.5349
2015 Patents per 1000 People: 0.6020
Patents per Capita Growth Rate: 12.5%
Average Patents per 1000 People: 0.5061
 View Larger +
Prev
Next
6.
State: NEW HAMPSHIRE
2000 Population: 1,239,882
2000 Utility Patent Count: 627
2015 Population: 1,330,111
2015 Utility Patent Count: 850
2000 Patents per 1000 People: 0.5057
2015 Patents per 1000 People: 0.6390
Patents per Capita Growth Rate: 26.4%
Average Patents per 1000 People: 0.5059
 View Larger +
Prev
Next
5.
State: VERMONT
2000 Population: 609,618
2000 Utility Patent Count: 377
2015 Population: 626,088
2015 Utility Patent Count: 451
2000 Patents per 1000 People: 0.6184
2015 Patents per 1000 People: 0.7203
Patents per Capita Growth Rate: 16.5%
Average Patents per 1000 People: 0.7536
 View Larger +
Prev
Next
4.
State: MINNESOTA
2000 Population: 4,933,692
2000 Utility Patent Count: 2,713
2015 Population: 5,482,435
2015 Utility Patent Count: 4,394
2000 Patents per 1000 People: 0.5499
2015 Patents per 1000 People: 0.8015
Patents per Capita Growth Rate: 45.8%
Average Patents per 1000 People: 0.6147
 View Larger +
Prev
Next
3.
State: WASHINGTON
2000 Population: 5,910,512
2000 Utility Patent Count: 1,820
2015 Population: 7,160,290
2015 Utility Patent Count: 6,378
2000 Patents per 1000 People: 0.3079
2015 Patents per 1000 People: 0.8907
Patents per Capita Growth Rate: 189.3%
Average Patents per 1000 People: 0.5742
 View Larger +
Prev
Next
2.
State: MASSACHUSETTS
2000 Population: 6,361,104
2000 Utility Patent Count: 3,458
2015 Population: 6,784,240
2015 Utility Patent Count: 6,777
2000 Patents per 1000 People: 0.5436
2015 Patents per 1000 People: 0.9989
Patents per Capita Growth Rate: 83.8%
Average Patents per 1000 People: 0.6860
 View Larger +
Prev
Next
1.
State: CALIFORNIA
2000 Population: 33,987,977
2000 Utility Patent Count: 17,491
2015 Population: 38,993,940
2015 Utility Patent Count: 40,196
2000 Patents per 1000 People: 0.5146
2015 Patents per 1000 People: 1.0308
Patents per Capita Growth Rate: 100.3%
Average Patents per 1000 People: 0.6742
Enjoy this post? Share it with others.