

John Perilli -- The Providence School Fiasco: What Can We Learn?
John Perilli, GoLocalProv MINDSETTER™
John Perilli -- The Providence School Fiasco: What Can We Learn?
When it was revealed that special needs student administrator Nancy Stevenin bought her Bachelor’s from a degree mill, it seemed both a disgrace and a tragedy. How could someone who does such a noble thing for such a marginalized group of students commit such a deception? Then, to compound the problem, Superintendent Lusi allowed Stevenin to keep her job and pursue a real degree with nothing but a slap on the wrist.
The outcry was immediate. Providence Mayoral candidate and City Council President Michael Solomon called upon Lusi to reconsider the decision, speaking the opinions of many. In the end, Stevenin chose to resign.
GET THE LATEST BREAKING NEWS HERE -- SIGN UP FOR GOLOCAL FREE DAILY EBLASTMake no mistake, though: This is not the last time a public administrator will be dragged through the mud. With hundreds of administrators on our state and local payrolls––and often minimal resources for oversight––there will almost certainly be another brouhaha like this in the future. All the same, there are still many lessons we can learn. This was an event far more complex than the simple lack-of-judgment story it’s been painted as, involving a whole tangled thornbush of issues including a vulnerable student population, public employment, and the very mechanics of the labor market itself.
As I said: What a mess! Here are a few things we can learn from this Providence School Department fracas.
Lesson 1: Deciding What to Pay Administrators is Really Difficult
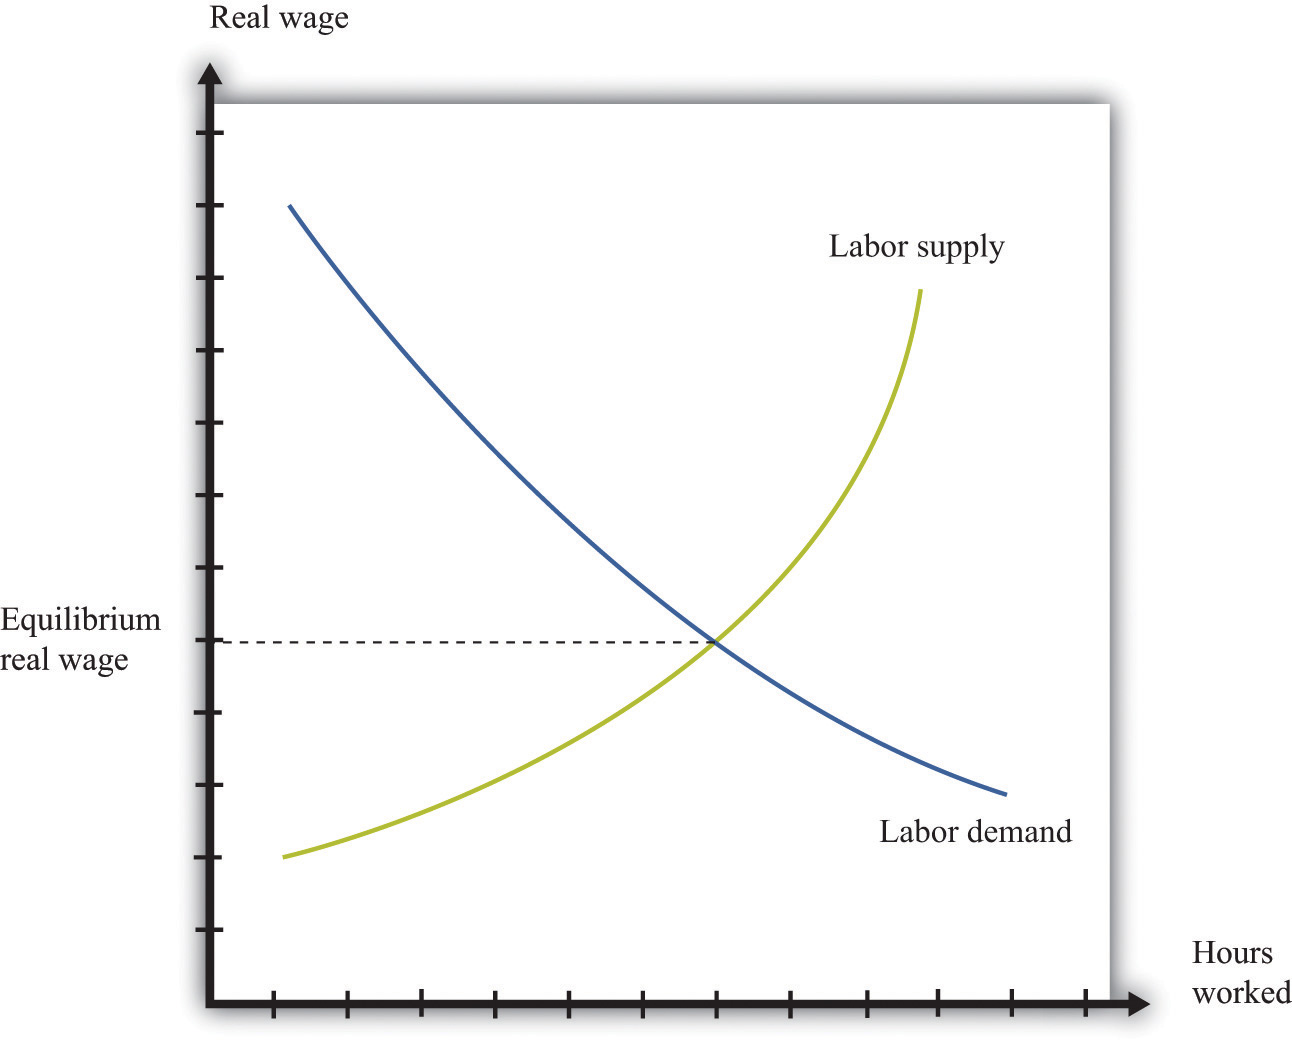
If you’ve ever taken an introductory-level economics class, you’ve probably seen the simple model of the labor market, with its sloping lines representing labor supply and labor demand. The theory runs that when the labor supply and labor demand are equalized, workers are employed at some wage which represents their individual contribution to their employer.
I call this a “simple” model because it only gets more complicated from here. Imagine you’re hiring an administrator, like Nancy Stevenin, rather than a ground-level employee. How are you, a layperson without a Ph.D in Economics, supposed to figure out to a dollar amount just what she would contribute to the bottom line? This becomes even more difficult if you’re the Providence School Department, a public agency which doesn’t compete for profit.
Then there is the fact that, as Superintendent Lusi puts it, Stevenin is “one of the most qualified professionals in her field in Rhode Island.” This fact also muddles the situation, because Stevenin has some distinguishing characteristic that makes her unlike other workers. In the end, Stevenin’s salary of $94,000 becomes an extraordinarily difficult number to arrive at fairly. It is more than thrice Rhode Island’s per capita income of around $28,700, and more than $35,000 higher than the salary of the average Rhode Island teacher. Many commentators have implied that Stevenin’s salary was too high, but I believe the issue is more complicated. How does one even figure out how to compensate administrators who do valuable and necessary work? With so much work to be done in our state, it is not only important that it actually get done, but also that those doing it be compensated fairly.
Lesson 2: Lying Hurts the Labor Market
Salary aside, though, Nancy Stevenin did commit one of the cardinal sins of economics: she lied about her qualifications.
Labor economics is a complicated business, but the entire theory of the labor market is based on a crucial assumption: Complete Information. This means that employers and employees know all relevant information about each other and are making completely informed decisions.
Obviously, this is never completely true in practice, but there is a difference between a simple lack of knowledge and a deliberate deception. I have no doubt that Nancy Stevenin was a qualified individual, but which other qualified individuals did she wrong by purchasing a junk degree? During such tough economic times, we can’t have the labor market break down like this. And having Superintendent Lusi reinforce this breakage only makes things worse. If the practice of buying a fake degree and expecting your supervisors to back you up becomes at all engrained or normalized, what little confidence we have left in our economy and our institutions could be shattered, and our suffering prolonged.
Lesson 3: Think Of the Children
Economists make their money studying markets, not morals. So we must keep in mind that besides the economics, there is also a human element in Stevenin’s case. Nancy Stevenin’s job involved overseeing some of the most vulnerable students in Providence, and by all accounts she did her job well. Her sudden resignation will doubtless be a setback for these students.
How, then, are we to enforce economic justice while ensuring that we don’t make life worse for people who are vulnerable or marginalized? In calls for Superintendent Lusi to “reconsider” her decision, I don’t think she got enough credit for how carefully she handled the situation. If she had immediately fired Stevenin, the students of Birch Vocational School where Stevenin worked could have been dealt a serious blow.
What if the next administrator dragged through the mud works with mental health patients? Or high-risk prisoners? Or addicts? How are we to punish unruly administrators for their misdeeds without also punishing those in their care?
Lesson 4: Understand the Incentives
I could go on for pages about how Nancy Stevenin’s junk degree insulted the thousands of jobseekers with real credentials, but that would be a waste of time. What would be more fruitful is to ask: Why did Stevenin, an otherwise competent individual, feel the need to buy a fake degree?
Could it be the prohibitive costs of college? The lack of opportunity in the job market for smart, ambitious workers without the time or money for a degree? Or could it simply be just a personal desire to cut corners, with no social implications at all?
Maybe Stevenin will go public with her rationale, and maybe she will not; however, it is still important for us to try to understand her motives. Because Stevenin was far from the only patron of “Ashley University,” and if we are to combat the menace of fake degrees, we must know what drives their customers.
Ultimately, I believe Stevenin’s departure was inevitable. But she will not be the last local government administrator to resign in disgrace. Unless our cities and our state learn how to better hire, oversee and fire those public servants in which they vest the most trust, then they will lose that public trust altogether.
John Perilli is a native of Cumberland, RI and a rising senior at Brown University. He works for Magaziner for Treasurer. The opinions represented in this piece do not represent the opinions of any organizations John Perilli is affiliated with. You can follow John on Twitter @JohnPerilli
The Most and Least Diverse High Schools in Rhode Island

#49 Ponaganset HS
North Scituate, RI
Total enrollment: 722
Percentage of total enrollment
Amer Indian/Alaskan: 0.0%
Asian/Pacific Islander: <1%
Black: <1%
Hispanic: <1%
Two or more races: 0.0%
White: 99%
Click here for this school's ranking on GoLocalProv's Top High Schools 2013

#48 Scituate HS
Scituate, RI
Total enrollment: 491
Percentage of total enrollment
Amer Indian/Alaskan: 0.0%
Asian/Pacific Islander: 1.0%
Black: 1.0%
Hispanic: 0.0%
Two or more races: 0.0%
White: 97.0%
Click here for this school's ranking on GoLocalProv's Top High Schools 2013

#47 Tiverton HS
Tiverton, RI
Total enrollment: 570
Percentage of total enrollment
Amer Indian/Alaskan: 0.0%
Asian/Pacific Islander: 1.0%
Black: 1.0%
Hispanic: 1.0%
Two or more races: 1.0%
White: 95%
Click here for this school's ranking on GoLocalProv's Top High Schools 2013

#46 Coventry HS
Coventry, RI
Total enrollment: 1,694
Percentage of total enrollment
Amer Indian/Alaskan: 0.0%
Asian/Pacific Islander: 0.0%
Black: 2.0%
Hispanic: 2.0%
Two or more races: 1.0%
White: 95.0%
Click here for this school's ranking on GoLocalProv's Top High Schools 2013

#45 Burrillville HS
Burrillville, RI
Total enrollment: 700
Percentage of total enrollment
Amer Indian/Alaskan: 0.0%
Asian/Pacific Islander: 1.0%
Black: 1.0%
Hispanic: 2.0%
Two or more races: 1.0%
White: 95.0%
Click here for this school's ranking on GoLocalProv's Top High Schools 2013

#44 Exeter-West Greenwich
West Greenwich, RI
Total enrollment: 652
Percentage of total enrollment
Amer Indian/Alaskan: 1.0%
Asian/Pacific Islander: 1.0%
Black: 1.0%
Hispanic: 3.0%
Two or more races: 0.0%
White: 95.0%
Click here for this school's ranking on GoLocalProv's Top High Schools 2013

#43 Chariho Regional HS
Wood River Junction, RI
Total enrollment: 1,136
Percentage of total enrollment
Amer Indian/Alaskan: 1.0%
Asian/Pacific Islander: 1.0%
Black: 1.0%
Hispanic: 2.0%
Two or more races: 1.0%
White: 94.0%
Click here for this school's ranking on GoLocalProv's Top High Schools 2013

#42 North Kingstown HS
North Kingstown, RI
Total enrollment: 1,454
Percentage of total enrollment
Amer Indian/Alaskan: 0.0%
Asian/Pacific Islander: 1.0%
Black: 2.0%
Hispanic: 3.0%
Two or more races: 1.0%
White: 93.0%
Click here for this school's ranking on GoLocalProv's Top High Schools 2013

#41 Mt. Hope HS
Bristol, RI
Total enrollment: 1,031
Percentage of total enrollment
Amer Indian/Alaskan: 0.0%
Asian/Pacific Islander: 0.0%
Black: 2.0%
Hispanic: 4.0%
Two or more races: 1.0%
White: 92.0%
Click here for this school's ranking on GoLocalProv's Top High Schools 2013

#40 Narragansett HS
Narragansett, RI
Total enrollment: 462
Percentage of total enrollment
Amer Indian/Alaskan: 0.0%
Asian/Pacific Islander: 1.0%
Black: 1.0%
Hispanic: 4.0%
Two or more races: 2.0%
White: 92.0%
Click here for this school's ranking on GoLocalProv's Top High Schools 2013

#39 Barrington HS
Barrington, RI
Total enrollment: 1,037
Percentage of total enrollment
Amer Indian/Alaskan: 0.0%
Asian/Pacific Islander: 5.0%
Black: 1.0%
Hispanic: 1.0%
Two or more races: 1.0%
White: 92.0%
Click here for this school's ranking on GoLocalProv's Top High Schools 2013

#38 Smithfield Senior HS
Smithfield, RI
Total enrollment: 772
Percentage of total enrollment
Amer Indian/Alaskan: 0.0%
Asian/Pacific Islander: 1.0%
Black: 2.0%
Hispanic: 3.0%
Two or more races: 2.0%
White: 92.0%
Click here for this school's ranking on GoLocalProv's Top High Schools 2013

#37 Portsmouth HS
Portsmouth, RI
Total enrollment: 974
Percentage of total enrollment
Amer Indian/Alaskan: 1.0%
Asian/Pacific Islander: 2.0%
Black: 3.0%
Hispanic: 2.0%
Two or more races: 0.0%
White: 92.0%
Click here for this school's ranking on GoLocalProv's Top High Schools 2013

#36 Lincoln Senior HS
Lincoln, RI
Total enrollment: 1,067
Percentage of total enrollment
Amer Indian/Alaskan: 0.0%
Asian/Pacific Islander: 0.0%
Black: 2.0%
Hispanic: 6.0%
Two or more races: 1.0%
White: 91.0%
Click here for this school's ranking on GoLocalProv's Top High Schools 2013

#35 North Smithfield HS
North Smithfield, RI
Total enrollment: 550
Percentage of total enrollment
Amer Indian/Alaskan: 0.0%
Asian/Pacific Islander: 2.0%
Black: 1.0%
Hispanic: 5.0%
Two or more races: 2.0%
White: 91.0%
Click here for this school's ranking on GoLocalProv's Top High Schools 2013

#34 Warwick Vets HS
Warwick Veterans Memorial HS, Warwick RI
Total enrollment: 992
Percentage of total enrollment
Amer Indian/Alaskan: 0.0%
Asian/Pacific Islander: 3.0%
Black: 2.0%
Hispanic: 5.0%
Two or more races: 1.0%
White: 89.0%
Click here for this school's ranking on GoLocalProv's Top High Schools 2013

#33 Toll Gate HS
Warwick, RI
Total enrollment: 982
Percentage of total enrollment
Amer Indian/Alaskan: 0.0%
Asian/Pacific Islander: 3.0%
Black: 3.0%
Hispanic: 6.0%
Two or more races: 1.0%
White: 87.0%
Click here for this school's ranking on GoLocalProv's Top High Schools 2013

#32 Pilgrim HS
Warwick, RI
Total enrollment: 1,078
Percentage of total enrollment
Amer Indian/Alaskan: 0.0%
Asian/Pacific Islander: 3.0%
Black: 2.0%
Hispanic: 7.0%
Two or more races: 2.0%
White: 86.0%
Click here for this school's ranking on GoLocalProv's Top High Schools 2013

#31 South Kingstown HS
South Kingstown, RI
Total enrollment: 1,095
Percentage of total enrollment
Amer Indian/Alaskan: 3.0%
Asian/Pacific Islander: 2.0%
Black: 2.0%
Hispanic: 4.0%
Two or more races: 4.0%
White: 86.0%
Click here for this school's ranking on GoLocalProv's Top High Schools 2013

#30 Cranston HS West
Cranston, RI
Total enrollment: 1,629
Percentage of total enrollment
Amer Indian/Alaskan: 0.0%
Asian/Pacific Islander: 3.0%
Black: 2.0%
Hispanic: 8.0%
Two or more races: 1.0%
White: 85.0%
Click here for this school's ranking on GoLocalProv's Top High Schools 2013

#29 East Greenwich HS
East Greenwich, RI
Total enrollment: 766
Percentage of total enrollment
Amer Indian/Alaskan: 0.0%
Asian/Pacific Islander: 6.0%
Black: 1.0%
Hispanic: 5.0%
Two or more races: 3.0%
White: 85.0%
Click here for this school's ranking on GoLocalProv's Top High Schools 2013

#28 Westerly HS
Westerly, RI
Total enrollment: 941
Percentage of total enrollment
Amer Indian/Alaskan: 1.0%
Asian/Pacific Islander: 6.0%
Black: 2.0%
Hispanic: 4.0%
Two or more races: 3.0%
White: 85.0%
Click here for this school's ranking on GoLocalProv's Top High Schools 2013

#27 Cumberland HS
Cumberland, RI
Total enrollment: 1,403
Percentage of total enrollment
Amer Indian/Alaskan: 0.0%
Asian/Pacific Islander: 2.0%
Black: 2.0%
Hispanic: 8.0%
Two or more races: 4.0%
White: 84.0%
Click here for this school's ranking on GoLocalProv's Top High Schools 2013

#26 West Warwick HS
West Warwick Senior HS, West Warwick, RI
Total enrollment: 982
Percentage of total enrollment
Amer Indian/Alaskan: 1.0%
Asian/Pacific Islander: 2.0%
Black: 3.0%
Hispanic: 11.0%
Two or more races: 1.0%
White: 82.0%
Click here for this school's ranking on GoLocalProv's Top High Schools 2013

#25 Johnston Senior HS
Johnston, RI
Total enrollment: 903
Percentage of total enrollment
Amer Indian/Alaskan: 0.0%
Asian/Pacific Islander: 2.0%
Black: 5.0%
Hispanic: 13.0%
Two or more races: 0.0%
White: 80.0%
Click here for this school's ranking on GoLocalProv's Top High Schools 2013
#24 Beacon Charter HS
Beacon Charter High School For The Arts, Woonsocket, RI
Total enrollment: 230
Percentage of total enrollment
Amer Indian/Alaskan: 1.0%
Asian/Pacific Islander: 3.0%
Black: 6.0%
Hispanic: 10.0%
Two or more races: 1.0%
White: 80.0%
Click here for this school's ranking on GoLocalProv's Top High Schools 2013

#23 Middletown HS
Middletown, RI
Total enrollment: 737
Percentage of total enrollment
Amer Indian/Alaskan: 0.0%
Asian/Pacific Islander: 3.0%
Black: 7.0%
Hispanic: 9.0%
Two or more races: 4.0%
White: 78.0%
Click here for this school's ranking on GoLocalProv's Top High Schools 2013

#22 East Providence HS
East Providence, RI
Total enrollment: 1,564
Percentage of total enrollment
Amer Indian/Alaskan: 1.0%
Asian/Pacific Islander: 1.0%
Black: 13.0%
Hispanic: 5.0%
Two or more races: 3.0%
White: 77.0%
Click here for this school's ranking on GoLocalProv's Top High Schools 2013

#21 Acad. for Career Exp.
Academy for Career Exploration, Providence, RI
Total enrollment: 207
Percentage of total enrollment
Amer Indian/Alaskan: 0.0%
Asian/Pacific Islander: 1.0%
Black: 18.0%
Hispanic: 75.0%
Two or more races: 1.0%
White: 4.0%
Click here for this school's ranking on GoLocalProv's Top High Schools 2013

#20 Central Falls HS
Central Falls, RI
Total enrollment: 838
Percentage of total enrollment
Amer Indian/Alaskan: 0.0%
Asian/Pacific Islander: 0.0%
Black: 15.0%
Hispanic: 74.0%
Two or more races: 1.0%
White: 10.0%
Click here for this school's ranking on GoLocalProv's Top High Schools 2013

#19 Cooley Health/Science
Cooley Health & Science Technology Academy, Providence, RI
Total enrollment: 717
Percentage of total enrollment
Amer Indian/Alaskan: 1.0%
Asian/Pacific Islander: 5.0%
Black: 16.0%
Hispanic: 74.0%
Two or more races: 1.0%
White: 3.0%
Click here for this school's ranking on GoLocalProv's Top High Schools 2013

#18 North Providence HS
North Providence, RI
Total enrollment: 998
Percentage of total enrollment
Amer Indian/Alaskan: 1.0%
Asian/Pacific Islander: 3.0%
Black: 8.0%
Hispanic: 16.0%
Two or more races: 0.0%
White: 72.0%
Click here for this school's ranking on GoLocalProv's Top High Schools 2013

#17 Times 2 Academy
Providence, RI
Total enrollment: 652
Percentage of total enrollment
Amer Indian/Alaskan: 1.0%
Asian/Pacific Islander: 1.0%
Black: 32.0%
Hispanic: 55.0%
Two or more races: 4.0%
White: 6.0%
Click here for this school's ranking on GoLocalProv's Top High Schools 2013

#16 Central HS
Providence, RI
Total enrollment: 1,101
Percentage of total enrollment
Amer Indian/Alaskan: 1.0%
Asian/Pacific Islander: 8.0%
Black: 16.0%
Hispanic: 70.0%
Two or more races: 2.0%
White: 3.0%
Click here for this school's ranking on GoLocalProv's Top High Schools 2013

#15 Mt. Pleasant HS
Providence, RI
Total enrollment: 884
Percentage of total enrollment
Amer Indian/Alaskan: 1.0%
Asian/Pacific Islander: 4.0%
Black: 24.0%
Hispanic: 62.0%
Two or more races: 2.0%
White: 6.0%
Click here for this school's ranking on GoLocalProv's Top High Schools 2013

#14 Prov. Career & Tech
Providence Career & Technical Academy, Providence, RI
Total enrollment: 568
Percentage of total enrollment
Amer Indian/Alaskan: 0.0%
Asian/Pacific Islander: 5.0%
Black: 16.0%
Hispanic: 69.0%
Two or more races: 2.0%
White: 7.0%
Click here for this school's ranking on GoLocalProv's Top High Schools 2013

#13 Dr. Jorge Alvarez HS
Dr. Jorge Alvarez High School, Providence, RI
Total enrollment: 563
Percentage of total enrollment
Amer Indian/Alaskan: 1.0%
Asian/Pacific Islander: 9.0%
Black: 15.0%
Hispanic: 69.0%
Two or more races: 2.0%
White: 4.0%
Click here for this school's ranking on GoLocalProv's Top High Schools 2013

#12 E-Cubed Academy
Providence, RI
Total enrollment: 360
Percentage of total enrollment
Amer Indian/Alaskan: 1.0%
Asian/Pacific Islander: 3.0%
Black: 29.0%
Hispanic: 54.0%
Two or more races: 3.0%
White: 10.0%
Click here for this school's ranking on GoLocalProv's Top High Schools 2013

#11 Hope Arts School
Providence, RI
Total enrollment: 1,035
Percentage of total enrollment
Amer Indian/Alaskan: 1.0%
Asian/Pacific Islander: 6.0%
Black: 25.0%
Hispanic: 56.0%
Two or more races: 3.0%
White: 9.0%
Click here for this school's ranking on GoLocalProv's Top High Schools 2013

#10 Woonsocket HS
Woonsocket, RI
Total enrollment: 1,736
Percentage of total enrollment
Amer Indian/Alaskan: 0.0%
Asian/Pacific Islander: 6.0%
Black: 11.0%
Hispanic: 27.0%
Two or more races: 4.0%
White: 52.0%
Click here for this school's ranking on GoLocalProv's Top High Schools 2013

#9 Shea Senior HS
Pawtucket, RI
Total enrollment: 905
Percentage of total enrollment
Amer Indian/Alaskan: 1.0%
Asian/Pacific Islander: 1.0%
Black: 46.0%
Hispanic: 33.0%
Two or more races: 5.0%
White: 14.0%
Click here for this school's ranking on GoLocalProv's Top High Schools 2013

#8 Cranston HS East
Cranston, RI
Total enrollment: 1,587
Percentage of total enrollment
Amer Indian/Alaskan: 1.0%
Asian/Pacific Islander: 10.0%
Black: 7.0%
Hispanic: 32.0%
Two or more races: 4.0%
White: 47.0%
Click here for this school's ranking on GoLocalProv's Top High Schools 2013

#7 Blackstone Academy
Blackstone Academy Charter School, Pawtucket, RI
Total enrollment: 165
Percentage of total enrollment
Amer Indian/Alaskan: 0.0%
Asian/Pacific Islander: 3.0%
Black: 21.0%
Hispanic: 57.0%
Two or more races: 3.0%
White: 15.0%
Click here for this school's ranking on GoLocalProv's Top High Schools 2013

#6 Jacqueline M. Walsh
Jacqueline M. Walsh School for the Performing and Visual Arts, Pawtucket, RI
Total enrollment: 167
Percentage of total enrollment
Amer Indian/Alaskan: 0.0%
Asian/Pacific Islander: 2.0%
Black: 14.0%
Hispanic: 28.0%
Two or more races: 6.0%
White: 50.0%
Click here for this school's ranking on GoLocalProv's Top High Schools 2013

#5 Rogers HS
Newport, RI
Total enrollment: 587
Percentage of total enrollment
Amer Indian/Alaskan: 2.0%
Asian/Pacific Islander: 1.0%
Black: 25.0%
Hispanic: 20.0%
Two or more races: 3.0%
White: 49.0%
Click here for this school's ranking on GoLocalProv's Top High Schools 2013

#4 The MET School
The Metropolitan Regional Career and Technical Center, Providence, RI
Total enrollment: 868
Percentage of total enrollment
Amer Indian/Alaskan: 2.0%
Asian/Pacific Islander: 2.0%
Black: 15.0%
Hispanic: 42.0%
Two or more races: 4.0%
White: 35.0%
Click here for this school's ranking on GoLocalProv's Top High Schools 2013

#3 Davies Career & Tech
Davies Career & Technical High School, Providence, RI
Total enrollment: 833
Percentage of total enrollment
Amer Indian/Alaskan: 1.0%
Asian/Pacific Islander: 6.0%
Black: 13.0%
Hispanic: 39.0%
Two or more races: 4.0%
White: 38.0%
Click here for this school's ranking on GoLocalProv's Top High Schools 2013

#2 William E. Tolman HS
William E. Tolman Senior High School, Pawtucket, RI
Total enrollment: 1,050
Percentage of total enrollment
Amer Indian/Alaskan: 1.0%
Asian/Pacific Islander: 1.0%
Black: 18.0%
Hispanic: 37.0%
Two or more races: 6.0%
White: 37.0%
Click here for this school's ranking on GoLocalProv's Top High Schools 2013

#1 Classical HS
Providence, RI
Total enrollment: 1,113
Percentage of total enrollment
Amer Indian/Alaskan: 1.0%
Asian/Pacific Islander: 9.0%
Black: 16.0%
Hispanic: 46.0%
Two or more races: 3.0%
White: 26.0%
Click here for this school's ranking on GoLocalProv's Top High Schools 2013


