
RI Fishing Industry Faces Extinction under Federal Regulations
Thursday, December 12, 2013
It’s hard to image an Ocean State without a commercial fishing industry, but one local business owner warns it could happen.

Increasingly restrictive federal regulations have cut the commercial fishing fleet in half over the last four years and are imperiling its future, according to Richard Fuka, the president of the Rhode Island Fishermen’s Alliance.
“We’re at a dangerous low level,” Fuka said. If the fleet is diminished any further, Rhode Islanders could see a local heritage industry “slip away” and become “a museum piece,” Fuka says. Further tightening federal regulations he says could be just thing that pushes the industry over the edge, according to Fuka. (See below slides for data on the decline.)
GET THE LATEST BREAKING NEWS HERE -- SIGN UP FOR GOLOCAL FREE DAILY EBLASTFuka said things took a decided turn for the worse after President Obama took office and his new appointee for the National Oceanic and Atmospheric Agenda has pursued a more aggressive regulatory agenda. But he says the industry was already chafing under regulations passed in the later years of the Bush administration.
Fishing contributes more than half a billion to RI economy
Data from an October 2011 study conducted by Cornell University confirm that the commercial fishing industry in Rhode Island was in decline, even before the full effect of the new regulations was felt. The number of state-licensed boats dropped from 1,488 to 1,298 between 2005 and 2011. Likewise, the demand for many state licenses has dried up. In 2011 the state issued 1,017 multi-purpose licenses. In 2011, it issued 867.
The decline in the Rhode Island fishing fleet is taking an economic toll as well: between 2006 and 2010, sales of locally caught fish dropped from $98.5 million to $60.4 million, according to the study. It was apparently the worst year since 1982, when sales were $56.7 million, in an absolute dollars-to-dollars comparison. But when those 1982 figures are adjusted for inflation, sales that year were actually $126 million, researchers found.

The fishing industry is a vital economic sector for Rhode Island. In 2010, commercial fishing generated a total of $763.3 million in sales and $239.9 million in income, when its indirect impact on distributors, restaurants, and grocers is taken into account, according to the study. The number of jobs related to the industry stood at 8,995.
The local restaurant industry is particularly reliant on commercial fishing, which generated $52.3 million in sales and $86.2 million in income for restaurants, along with 4,207 jobs, the data shows.
Congressmen push back at federal level
“The importance of the fishing and marine trades industries to our state’s economy cannot be overstated, and I am very concerned about the problems facing fishermen today,” Congressman Jim Langevin said in a statement provided to GoLocalProv. “Despite our fishermen adhering to strict catch limits designed to prevent overfishing, stock rebuilding has been unexpectedly slow. We must look at all factors affecting stock recovery, including environmental variables such as climate change.”
Langevin, whose district encompasses many of the communities with large fishing ports, said he has been an advocate for increased funding for local fisheries, especially funds from disaster-relief sources.
He has also jointed with Senator Jack Reed to introduce a measure known as the Rhode Island Fishermen’s Fairness Act, which he said would “give our state’s fishery professionals a stronger voice” in the industry. “The legislation would create two new spots for Rhode Island on the Mid-Atlantic Fisheries Management Council, so our fishermen have a say in the management of fish stocks important to the Rhode Island economy, including squid, mackerel and butterfish,” Langevin said.
So far, however, the bill has not made much headway in Congress. The House version of the measure was assigned to committee on April 11, 2013 and no action is recorded as being taken on it since then, according to the Web site govtrack.us. The Senate version, which was introduced on the same date, hasn’t made it past committee either, Congressional records show.

Kilmartin argues that federal regulators ignore economic impact
The deepening concern over the future of fishing in Rhode Island also led state Attorney General Peter Kilmartin this week to file a court brief in support of a Massachusetts lawsuit against federal regulations that impose lower quotas on certain types of groundfish—fish like cod, halibut, and haddock which are found near the bottom of the sea floor. The new quotas threaten to drop the amount of fish Bay State fishermen can catch by 77 percent, according to Kilmartin’s office.
In his brief, Kilmartin said federal regulators did not properly account for the economic impact of the new regulations.
Because local fishermen have a more diverse stock of fish, the impact of the quotas—which apply to the region stretching from New York to Maine—will be less severe in Rhode Island. “We have a much more diverse fleet, so we’re able to weather this storm even though this lawsuit is extremely important to us,” Fuka said.
Kilmartin is hoping to pre-empt federal regulators from taking similar steps here, according to spokeswoman Amy Kempe. “It could just as easily be Rhode Island next time,” Kempe said.
“For now it appears that Rhode Island will most likely escape the devastating impact that the Commonwealth is facing,” Kilmartin says in the brief. “However, it is clear that if the Secretary [of Commerce] imposed the same draconian reductions upon Rhode Island’s top commercial landings, the impact would be devastating to the Rhode Island Fishing community.”
Although fishing conditions are different, Rhode Island fishermen can relate to battle of Massachusetts fishermen against federal regulators, Fuka said. “We went through the same kind of genocide, so to speak,” he said.

The federal regulations at issue
The regulation Rhode Island fishermen find particularly burdensome is known as “catch-share.” It’s a system that allocates certain quotas of fish to groups of fishermen from New York to Maine. Those groups decide how to divvy up the their share of the fish quotas they are allowed, according to Maggie Mooney-Seus, a public affairs officer for NOAA’s Northeast Regional Office, in Gloucester, Mass.
Fuka said the catch-share program is inflexible because it bases quotas on historical records for the numbers of different species caught by local boats. Mooney-Seus, on the other hand, said catch-share is a more flexible alternative to even stricter groundfish quotas that were developed in 2010. Generally speaking, those quotas impose limits on individual boats, rather on groups of fishermen.
Mooney-Seus said fishermen in the northeast region have the choice to operate under the individual quotas or participate in the catch-share program. Rhode Island fishermen are represented in both programs, she said.
Mooney-Seus said the goal of the regulations is the rebuilding of depleted fish stocks, in compliance with certain criteria spelled out in federal law. “The quotas are strict and the quotas have been cut—and pretty drastically since 2010,” Mooney-Seus said.
Even though environmental factors, rather than overfishing, may be behind some drops in fish populations, she said the only tool NOAA has at its disposal is regulations on fishing quotas. So, if the agency sees a fish struggling to come back, it must reduce the effort to fish that species, she said.
The quotas are developed on a regional rather than a state-by-state basis. All the fishermen in the region cannot fish a species beyond that quota. Fishing efforts regionally are tracked and coordinated through a thorough system of recordkeeping. (Each boat must keep a log of what it catches and discards and the fish houses that buy what they keep also must keep logs. Boats also are equipped with black boxes which allow government authorities to track their movements, according to Fuka.)

NOAA data shows deep cuts in the regional quotas of fish, which typically change each fishing year (May 1 to April 30). For example, in 2012, fishermen from Southern New England to Down East Maine could haul in 162 metric tons of cod fish off George’s Bank—a large elevated area of the sea floor about 60 miles offshore between Cape Cod and Nova Scotia. In 2013, that quota (or catch limit) was cut nearly in half—to 92 metric tons.
Some of the most severe cuts were for haddock found off Georges Bank, for which the catch limit in 2013 plummeted by 71 percent of what was allowed in 2012. For the yellowtail flounder, the reduction was 68.5 percent.
On a regional level, however, a closer look at the data suggests that quotas are not as restrictive as they might seem. For example, while regional fishermen were allowed 162 metric tons of cod off Georges Bank in 2012, they only took in 67.5 metric tons. Presumably, then, a catch limit of 92 metric tons would not necessarily alter their catch.
However, the figures Mooney-Seus provided were for the entire region of groundfish her office monitors, which stretches from New York to Maine. On a smaller scale, those limits could force deep cuts into local fishing efforts. For example, while the regional stock of cod has been severely depleted, the stock in one area (such as Gloucester, Mass.) might be thriving. From their point of view, the new quotas might seem to be an unnecessary and undue burden on their business.
“To some degree, it is still a matter of perspective,” Mooney-Seus said.
Stephen Beale can be reached at [email protected]. Follow him on Twitter @bealenews
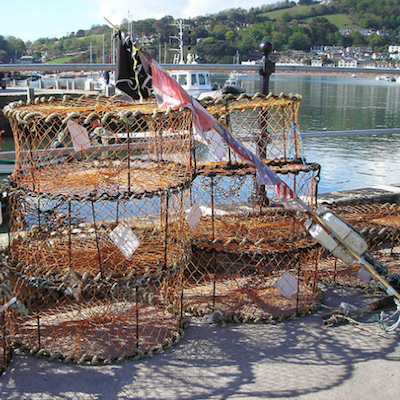
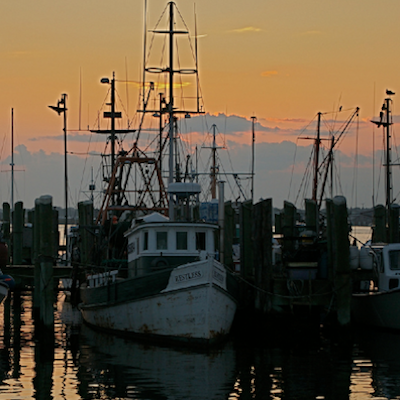
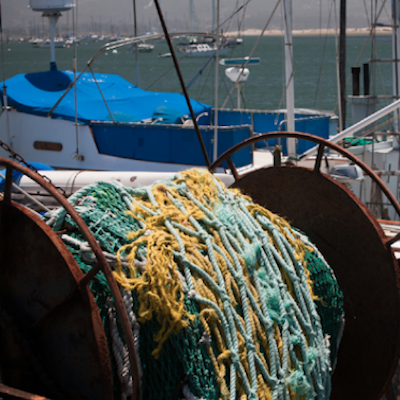
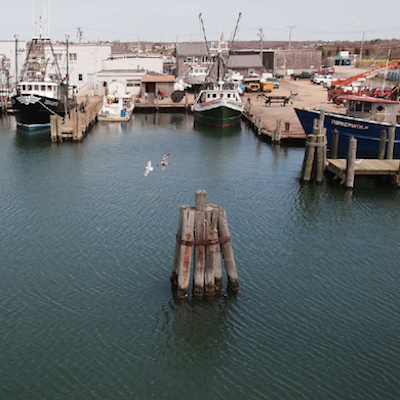
Related Slideshow: RI Fishing Industry’s Decline by the Numbers
The Rhode Island commercial fishing industry is in trouble. A study conducted in 2011 by Cornell University offered a portrait of an industry in crisis, with declines in sales, fishing vessels, and many types of permits. That study also showed how important the preservation of the fishing industry is to the state economy. Below are key figures on the decline and current state of the fishing industry in Rhode Island excerpted from the study. Some data is also taken from the National Oceanic and Atmospheric Administration.


Related Articles
- NEW: Top Federal Fisheries Officials to Meet with RI Fishing Community
- Will New Regulations Doom RI’s Fishing Industry?
