How White is Your School? The Most Diverse High Schools in RI
Tuesday, March 25, 2014


View Larger +

Diversity at Rhode Island's 49 high schools range from one suburban high school with a 99% white student population, to a Providence high school with a 75% Hispanic student population -- and a variety of demographic breakdowns in between, according to the most recently reported statewide data.

"We have a teaching force that's 80% and 90% white, and 90% student body of color in Providence," said Jim Vincent, President of the NAACP's Providence Branch. "I know that RIDE's addressing the issue, but they're not doing enough. I think we need more diverse teachers, and we need to get more people of color interested in the profession. And that's on us, we need our best and brightest to see it it as profession. I challenge our community to step up and go into the field."

In order to determine Rhode Island's most -- and least -- diverse high schools, GoLocalProv.com analyzed data from the Institute for Education Science's National Center for Education Statistics to determine which of Rhode Island’s public high schools had the most overall racial balance. The more balanced a school's enrollment was across the categories measured by the NCES, the higher it ranked.

GET THE LATEST BREAKING NEWS HERE -- SIGN UP FOR GOLOCAL FREE DAILY EBLAST

See Rhode Island's Most and Least Diverse High Schools BELOW

Anna Cano Morales with the Latino Policy Institute at Roger Williams University spoke to the efforts that RIDE is undertaking to address dual language learners -- and diversity.

"I was happy to hear at Commissioner [Deborah] Gist's State of Education in January that she's making a big push for dual language education and language diversity of our schools," said Cano Morales. "[Gist] made it a point to bring students form Lima [Elementary School], and the International charter school -- they were worked into her speech, there was a call and answer session in Spanish, Portuguese."

"I think that's great, but how do you go further, and incentivize districts to create pilot programs to incubate some of the work that the International schools are doing, including looking at the French-American and other private schools?" continued Cano-Morales. "Let's go from the aspirational to practical. How do we get it down to policies that match up with the diversity issue?  Latino students are 22% of the student body across the state - and three out of every four students in the urban core.  We can't stop at simply recognizing that, we need baby steps. What are we going to do collectively?"

Looking at the Numbers

View Larger +

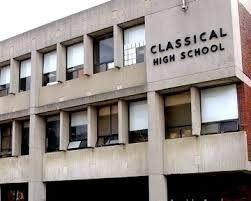
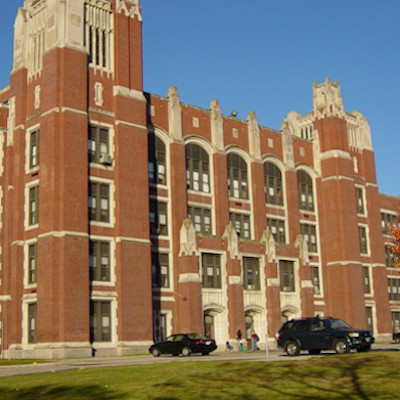
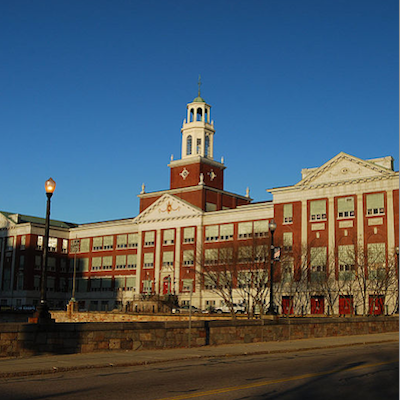
Classical High School, Providence,RI

According to the latest Census data available, Rhode Island's overall Hispanic population is 13.2%, Black or African American population is 7.3%, Asian population is 3.2%, two or more races at 2.9% -- and the white population is 75.3%

Classical High School, which tops GoLocal's list of diverse high schools, counted among its 1,113 students in the 2012-2013 school year 1% American Indian/Alaskan, 3% two or more races, 9% Asian/Pacific Islander , 16% black, 26% white, and 46% Hispanic.

See Ranking Methodology HERE

"It's just wonderful, we celebrate our diversity every day," said Classical Principal Scott Barr. "It's a great place to be Principal , to see such a great, positive student body. We're a true reflection of the city. We're diverse, which we embrace and celebrate. It's a great thing to be part of."

"Classical been around since 1843," said Barr, who is in his sixth year as head of the school. "The whole premise was that we were formed and developed to educate newcomers to the country. First and second generation kids here, they make lifelong friendships that are nurtured. When a kid leaves Classical, they've worked with so any kids from social and religious background, it prepares them for life -- it's an education you don't get many places -- making friends from different cultural backgrounds."

"Every school has their challenges, kids are kids, with relationships, the social interactions," continued Barr. "The challenges here are positive, they're rewarding, Classical accepts kids throughout the city, it's a beautiful place to meet with a common goal. The diversity has a positive effect. It's a great place to be."

Diversity in Teaching Ranks

View Larger +

How can Rhode Island get top marks for addressing diversity? Read what community leaders think.

Jim Vincent with the NAACP spoke to the issue of diversity in the schools -- at the teaching and professional staff levels.

"We have no diversity in leadership in the school districts, and the board of education staff," said Vincent. "We have to go a long way to make the state more representative of the students from the staff, to the school committees."

Vincent took particular issue with the suspension rates in the state, "The ACLU did an exhaustive suspension study, and every district suspends black kids for than white kids," said Vincent. "These out of school suspensions -- we're creating a school to prison pipeline. Where's the lobbying group lobbying for that? I know you need order..but having them out of school, when they should be in school, is counterintuitive."

"People say, those poor inner city students, who have one parent, or they're hungry, that's why," continued Vincent. "How does that explain that kids of color in Barrington, East Greenwich-- they're coming from professional, privilege -- and they're also being suspended two or three times more? That takes away the impoverished argument." Vincent noted that groups are currently working to address the suspension issue. "I think it's a work in progress."

Recently, The Rhode Island Department of Education approved new standards -- with a focus on recruiting a diverse teaching workforce

"One of our goals has been to attract individuals with diverse backgrounds into the teaching profession. To help with this initiative, we developed a new set of standards, which the Board of Education approved last year, for the approval of educator-preparation programs in Rhode Island. These standards set as one of the criteria for approval the commitment to recruit and support a diverse and high-quality pool of candidates," said Commissioner Gist.

Gist continued, "We’re also pleased that some of our schools, such as the mayoral academies, are especially committed to recruiting, supporting, and retaining a diverse faculty. In addition, we have made closing achievement gaps one of the key performance goals in our strategic plan for transforming education in Rhode Island and in our system of school accountability. We will continue with these efforts to attract high-quality candidates to the teaching profession and to advance teaching and learning for all Rhode Island students."

Role of Community and Advocacy

View Larger +

Anna Cano Morales

While the schools with the least diversity fell mainly in Rhode Islands' suburban and rural areas, the schools with the most diversity, which included Classical, Tolman, Davies, The MET, and Rogers -- are in the state's urban areas.

James Monteiro with the Billy Taylor House on the East Side of Providence, who mission is to "ignite the ambition of Providence’s most disconnected young people" saw community groups as playing a critical role in diverse populations.

"I think that with regard to the the school system -- the families need to step up more," said Monteiro. "It can't just be from the inside, it needs to be from the community. Families need to step up and have our voices heard. I've told Keith [Oliveira, Providence School Board President] that they need to be more transparent with families. I've known Keith, I think he's doing a good job. We need to know when things are happening, if we don't know what's happening and when, then how are we supposed to show up?"

Monteiro continued, "We need to educate the families more. When community centers are educated, we can translate the information to families and parents. I think those in power can do better. There's a lot of decisions made about funding, and minorities aren't at the table."

NAACP's Vincent saw youth groups as critical in the discussion around diversity. "I think in this state, I can think of 4 organizations right away, the NAACP Youth Council, the Providence Student Union, Young Voices, Youth in Action -- I admire them all. We have a lot of advocates that are youth-based in the state, as opposed to adults. It seems the people that are pushing hardest for reform are the youth. It's not the adults."

Cano-Morales called for increased support from the state to help address education and diversity issues.

"It's tough with people who come with a no excuses attitude, accountability.  In  and of itself, it doesn't lift all ships -- it has to be accountability and capacity," said Cano Morales. "I know that budgets have been cut and resources are limited, but if it's accountability we're talking about, it needs to be followed by, "and this is how we'll help you achieve it".

Cano Morales issued a call to action. "Let's have a Latino education summit. Let's bring educators who are making their mark today -- not the future," said Cano Morales. "The more we can target resources and best practices to look at diversity from accountability and capacity standpoint, that would go a long way."  


Related Slideshow: The Most and Least Diverse High Schools in Rhode Island

The data below reflects the 2012-13 academic year as provided by the Rhode Island Dept of Education. Values have been rounded to the nearest whole percent.

View Larger +
Prev Next

#49 Ponaganset HS

North Scituate, RI

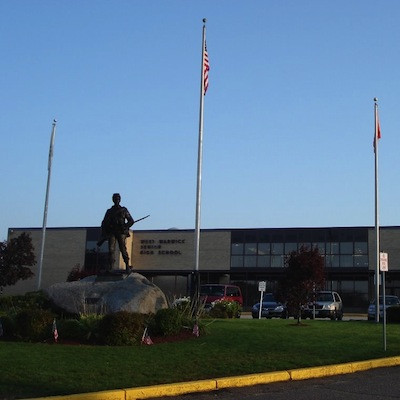
Total enrollment: 722

Percentage of total enrollment

Amer Indian/Alaskan: 0.0%
Asian/Pacific Islander: <1%
Black: <1%
Hispanic: <1%
Two or more races: 0.0%
White: 99%

Click here for this school's ranking on GoLocalProv's Top High Schools 2013

View Larger +
Prev Next

#48 Scituate HS

Scituate, RI

Total enrollment: 491

Percentage of total enrollment

Amer Indian/Alaskan: 0.0%
Asian/Pacific Islander: 1.0%
Black: 1.0%
Hispanic: 0.0%
Two or more races: 0.0%
White: 97.0%

Click here for this school's ranking on GoLocalProv's Top High Schools 2013

View Larger +
Prev Next

#47 Tiverton HS

Tiverton, RI

Total enrollment: 570

Percentage of total enrollment

Amer Indian/Alaskan: 0.0%
Asian/Pacific Islander: 1.0%
Black: 1.0%
Hispanic: 1.0%
Two or more races: 1.0%
White: 95%

Click here for this school's ranking on GoLocalProv's Top High Schools 2013

View Larger +
Prev Next

#46 Coventry HS

Coventry, RI

Total enrollment: 1,694

Percentage of total enrollment

Amer Indian/Alaskan: 0.0%
Asian/Pacific Islander: 0.0%
Black: 2.0%
Hispanic: 2.0%
Two or more races: 1.0%
White: 95.0%

Click here for this school's ranking on GoLocalProv's Top High Schools 2013

View Larger +
Prev Next

#45 Burrillville HS

Burrillville, RI

Total enrollment: 700

Percentage of total enrollment

Amer Indian/Alaskan: 0.0%
Asian/Pacific Islander: 1.0%
Black: 1.0%
Hispanic: 2.0%
Two or more races: 1.0%
White: 95.0%

Click here for this school's ranking on GoLocalProv's Top High Schools 2013

View Larger +
Prev Next

#44 Exeter-West Greenwich

West Greenwich, RI

Total enrollment: 652

Percentage of total enrollment

Amer Indian/Alaskan: 1.0%
Asian/Pacific Islander: 1.0%
Black: 1.0%
Hispanic: 3.0%
Two or more races: 0.0%
White: 95.0%

Click here for this school's ranking on GoLocalProv's Top High Schools 2013

View Larger +
Prev Next

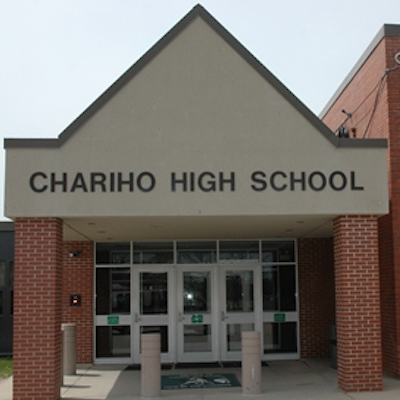
#43 Chariho Regional HS

Wood River Junction, RI

Total enrollment: 1,136

Percentage of total enrollment

Amer Indian/Alaskan: 1.0%
Asian/Pacific Islander: 1.0%
Black: 1.0%
Hispanic: 2.0%
Two or more races: 1.0%
White: 94.0%

Click here for this school's ranking on GoLocalProv's Top High Schools 2013

View Larger +
Prev Next

#42 North Kingstown HS

North Kingstown, RI

Total enrollment: 1,454

Percentage of total enrollment

Amer Indian/Alaskan: 0.0%
Asian/Pacific Islander: 1.0%
Black: 2.0%
Hispanic: 3.0%
Two or more races: 1.0%
White: 93.0%

Click here for this school's ranking on GoLocalProv's Top High Schools 2013

View Larger +
Prev Next

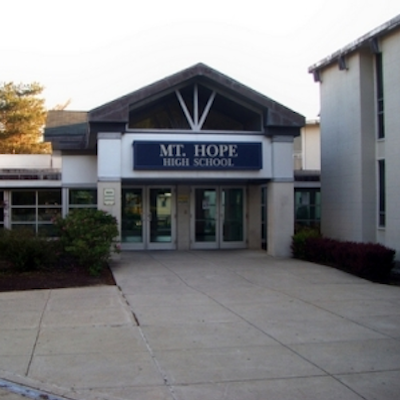
#41 Mt. Hope HS

Bristol, RI

Total enrollment: 1,031

Percentage of total enrollment

Amer Indian/Alaskan: 0.0%
Asian/Pacific Islander: 0.0%
Black: 2.0%
Hispanic: 4.0%
Two or more races: 1.0%
White: 92.0%

Click here for this school's ranking on GoLocalProv's Top High Schools 2013

View Larger +
Prev Next

#40 Narragansett HS

Narragansett, RI

Total enrollment: 462

Percentage of total enrollment

Amer Indian/Alaskan: 0.0%
Asian/Pacific Islander: 1.0%
Black: 1.0%
Hispanic: 4.0%
Two or more races: 2.0%
White: 92.0%

Click here for this school's ranking on GoLocalProv's Top High Schools 2013

View Larger +
Prev Next

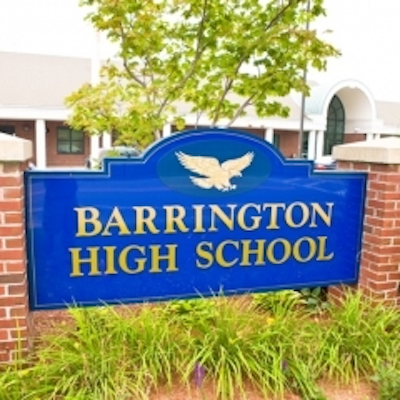
#39 Barrington HS

Barrington, RI

Total enrollment: 1,037

Percentage of total enrollment

Amer Indian/Alaskan: 0.0%
Asian/Pacific Islander: 5.0%
Black: 1.0%
Hispanic: 1.0%
Two or more races: 1.0%
White: 92.0%

Click here for this school's ranking on GoLocalProv's Top High Schools 2013

View Larger +
Prev Next

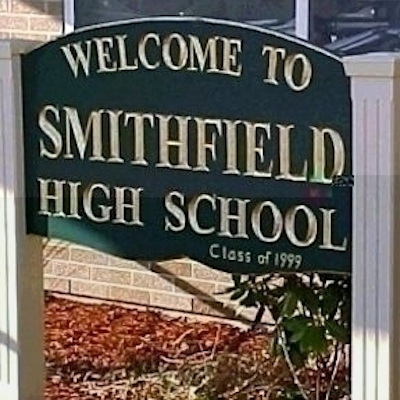
#38 Smithfield Senior HS

Smithfield, RI

Total enrollment: 772

Percentage of total enrollment

Amer Indian/Alaskan: 0.0%
Asian/Pacific Islander: 1.0%
Black: 2.0%
Hispanic: 3.0%
Two or more races: 2.0%
White: 92.0%

Click here for this school's ranking on GoLocalProv's Top High Schools 2013

View Larger +
Prev Next

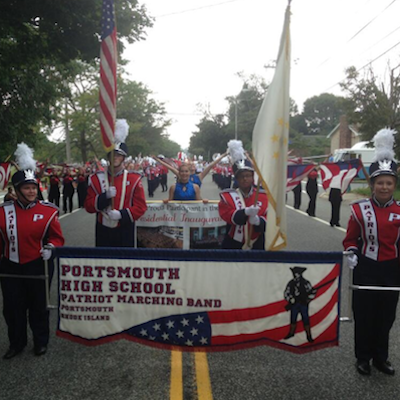
#37 Portsmouth HS

Portsmouth, RI

Total enrollment: 974

Percentage of total enrollment

Amer Indian/Alaskan: 1.0%
Asian/Pacific Islander: 2.0%
Black: 3.0%
Hispanic: 2.0%
Two or more races: 0.0%
White: 92.0%

Click here for this school's ranking on GoLocalProv's Top High Schools 2013

View Larger +
Prev Next

#36 Lincoln Senior HS

Lincoln, RI

Total enrollment: 1,067

Percentage of total enrollment

Amer Indian/Alaskan: 0.0%
Asian/Pacific Islander: 0.0%
Black: 2.0%
Hispanic: 6.0%
Two or more races: 1.0%
White: 91.0%

Click here for this school's ranking on GoLocalProv's Top High Schools 2013

View Larger +
Prev Next

#35 North Smithfield HS

North Smithfield, RI

Total enrollment: 550

Percentage of total enrollment

Amer Indian/Alaskan: 0.0%
Asian/Pacific Islander: 2.0%
Black: 1.0%
Hispanic: 5.0%
Two or more races: 2.0%
White: 91.0%

Click here for this school's ranking on GoLocalProv's Top High Schools 2013

View Larger +
Prev Next

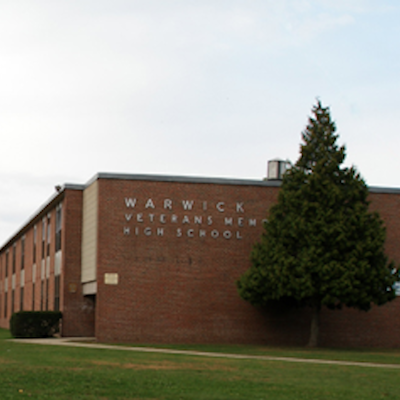
#34 Warwick Vets HS

Warwick Veterans Memorial HS, Warwick RI

Total enrollment: 992

Percentage of total enrollment

Amer Indian/Alaskan: 0.0%
Asian/Pacific Islander: 3.0%
Black: 2.0%
Hispanic: 5.0%
Two or more races: 1.0%
White: 89.0%

Click here for this school's ranking on GoLocalProv's Top High Schools 2013

View Larger +
Prev Next

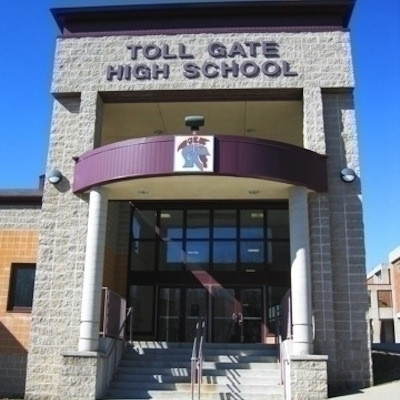
#33 Toll Gate HS

Warwick, RI

Total enrollment: 982

Percentage of total enrollment

Amer Indian/Alaskan: 0.0%
Asian/Pacific Islander: 3.0%
Black: 3.0%
Hispanic: 6.0%
Two or more races: 1.0%
White: 87.0%

Click here for this school's ranking on GoLocalProv's Top High Schools 2013

View Larger +
Prev Next

#32 Pilgrim HS

Warwick, RI

Total enrollment: 1,078

Percentage of total enrollment

Amer Indian/Alaskan: 0.0%
Asian/Pacific Islander: 3.0%
Black: 2.0%
Hispanic: 7.0%
Two or more races: 2.0%
White: 86.0%

Click here for this school's ranking on GoLocalProv's Top High Schools 2013

View Larger +
Prev Next

#31 South Kingstown HS

South Kingstown, RI

Total enrollment: 1,095

Percentage of total enrollment

Amer Indian/Alaskan: 3.0%
Asian/Pacific Islander: 2.0%
Black: 2.0%
Hispanic: 4.0%
Two or more races: 4.0%
White: 86.0%

Click here for this school's ranking on GoLocalProv's Top High Schools 2013

View Larger +
Prev Next

#30 Cranston HS West

Cranston, RI

Total enrollment: 1,629

Percentage of total enrollment

Amer Indian/Alaskan: 0.0%
Asian/Pacific Islander: 3.0%
Black: 2.0%
Hispanic: 8.0%
Two or more races: 1.0%
White: 85.0%

Click here for this school's ranking on GoLocalProv's Top High Schools 2013

View Larger +
Prev Next

#29 East Greenwich HS

East Greenwich, RI

Total enrollment: 766

Percentage of total enrollment

Amer Indian/Alaskan: 0.0%
Asian/Pacific Islander: 6.0%
Black: 1.0%
Hispanic: 5.0%
Two or more races: 3.0%
White: 85.0%

Click here for this school's ranking on GoLocalProv's Top High Schools 2013

View Larger +
Prev Next

#28 Westerly HS

Westerly, RI

Total enrollment: 941

Percentage of total enrollment

Amer Indian/Alaskan: 1.0%
Asian/Pacific Islander: 6.0%
Black: 2.0%
Hispanic: 4.0%
Two or more races: 3.0%
White: 85.0%

Click here for this school's ranking on GoLocalProv's Top High Schools 2013

View Larger +
Prev Next

#27 Cumberland HS

Cumberland, RI

Total enrollment: 1,403

Percentage of total enrollment

Amer Indian/Alaskan: 0.0%
Asian/Pacific Islander: 2.0%
Black: 2.0%
Hispanic: 8.0%
Two or more races: 4.0%
White: 84.0%

Click here for this school's ranking on GoLocalProv's Top High Schools 2013

View Larger +
Prev Next

#26 West Warwick HS

West Warwick Senior HS, West Warwick, RI

Total enrollment: 982

Percentage of total enrollment

Amer Indian/Alaskan: 1.0%
Asian/Pacific Islander: 2.0%
Black: 3.0%
Hispanic: 11.0%
Two or more races: 1.0%
White: 82.0%

Click here for this school's ranking on GoLocalProv's Top High Schools 2013

View Larger +
Prev Next

#25 Johnston Senior HS

Johnston, RI

Total enrollment: 903

Percentage of total enrollment

Amer Indian/Alaskan: 0.0%
Asian/Pacific Islander: 2.0%
Black: 5.0%
Hispanic: 13.0%
Two or more races: 0.0%
White: 80.0%

Click here for this school's ranking on GoLocalProv's Top High Schools 2013

View Larger +
Prev Next

#24 Beacon Charter HS

Beacon Charter High School For The Arts, Woonsocket, RI

Total enrollment: 230

Percentage of total enrollment

Amer Indian/Alaskan: 1.0%
Asian/Pacific Islander: 3.0%
Black: 6.0%
Hispanic: 10.0%
Two or more races: 1.0%
White: 80.0%

Click here for this school's ranking on GoLocalProv's Top High Schools 2013

View Larger +
Prev Next

#23 Middletown HS

Middletown, RI

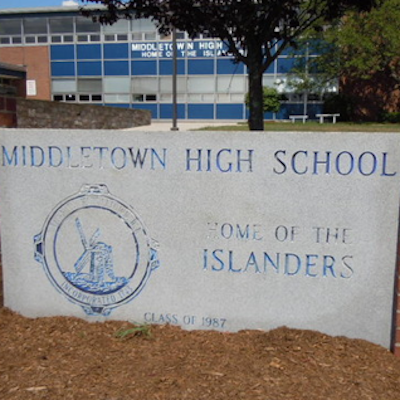
Total enrollment: 737

Percentage of total enrollment

Amer Indian/Alaskan: 0.0%
Asian/Pacific Islander: 3.0%
Black: 7.0%
Hispanic: 9.0%
Two or more races: 4.0%
White: 78.0%

Click here for this school's ranking on GoLocalProv's Top High Schools 2013

View Larger +
Prev Next

#22 East Providence HS

East Providence, RI

Total enrollment: 1,564

Percentage of total enrollment

Amer Indian/Alaskan: 1.0%
Asian/Pacific Islander: 1.0%
Black: 13.0%
Hispanic: 5.0%
Two or more races: 3.0%
White: 77.0%

Click here for this school's ranking on GoLocalProv's Top High Schools 2013

View Larger +
Prev Next

#21 Acad. for Career Exp.

Academy for Career Exploration, Providence, RI

Total enrollment: 207

Percentage of total enrollment

Amer Indian/Alaskan: 0.0%
Asian/Pacific Islander: 1.0%
Black: 18.0%
Hispanic: 75.0%
Two or more races: 1.0%
White: 4.0%

Click here for this school's ranking on GoLocalProv's Top High Schools 2013

View Larger +
Prev Next

#20 Central Falls HS

Central Falls, RI

Total enrollment: 838

Percentage of total enrollment

Amer Indian/Alaskan: 0.0%
Asian/Pacific Islander: 0.0%
Black: 15.0%
Hispanic: 74.0%
Two or more races: 1.0%
White: 10.0%

Click here for this school's ranking on GoLocalProv's Top High Schools 2013

View Larger +
Prev Next

#19 Cooley Health/Science

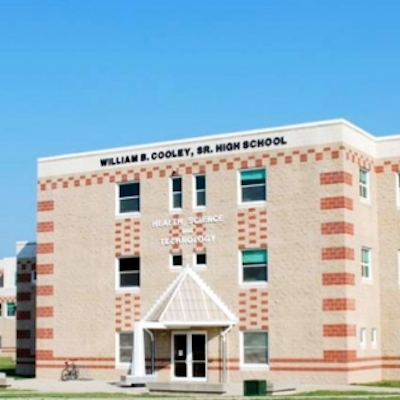
Cooley Health & Science Technology Academy, Providence, RI

Total enrollment: 717

Percentage of total enrollment

Amer Indian/Alaskan: 1.0%
Asian/Pacific Islander: 5.0%
Black: 16.0%
Hispanic: 74.0%
Two or more races: 1.0%
White: 3.0%

Click here for this school's ranking on GoLocalProv's Top High Schools 2013

View Larger +
Prev Next

#18 North Providence HS

North Providence, RI

Total enrollment: 998

Percentage of total enrollment

Amer Indian/Alaskan: 1.0%
Asian/Pacific Islander: 3.0%
Black: 8.0%
Hispanic: 16.0%
Two or more races: 0.0%
White: 72.0%

Click here for this school's ranking on GoLocalProv's Top High Schools 2013

View Larger +
Prev Next

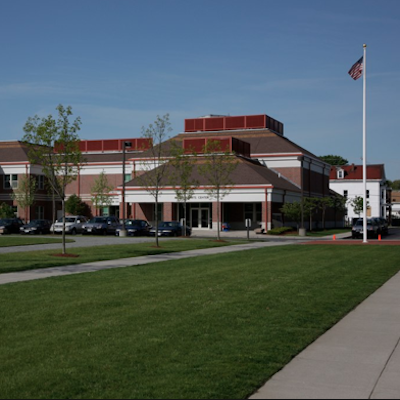
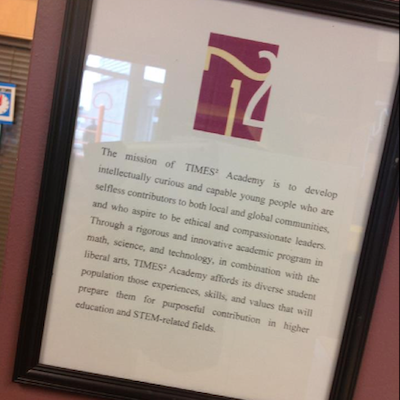
#17 Times 2 Academy

Providence, RI

Total enrollment: 652

Percentage of total enrollment

Amer Indian/Alaskan: 1.0%
Asian/Pacific Islander: 1.0%
Black: 32.0%
Hispanic: 55.0%
Two or more races: 4.0%
White: 6.0%

Click here for this school's ranking on GoLocalProv's Top High Schools 2013

View Larger +
Prev Next

#16 Central HS

Providence, RI

Total enrollment: 1,101

Percentage of total enrollment

Amer Indian/Alaskan: 1.0%
Asian/Pacific Islander: 8.0%
Black: 16.0%
Hispanic: 70.0%
Two or more races: 2.0%
White: 3.0%

Click here for this school's ranking on GoLocalProv's Top High Schools 2013

View Larger +
Prev Next

#15 Mt. Pleasant HS

Providence, RI

Total enrollment: 884

Percentage of total enrollment

Amer Indian/Alaskan: 1.0%
Asian/Pacific Islander: 4.0%
Black: 24.0%
Hispanic: 62.0%
Two or more races: 2.0%
White: 6.0%

Click here for this school's ranking on GoLocalProv's Top High Schools 2013

View Larger +
Prev Next

#14 Prov. Career & Tech

Providence Career & Technical Academy, Providence, RI

Total enrollment: 568

Percentage of total enrollment

Amer Indian/Alaskan: 0.0%
Asian/Pacific Islander: 5.0%
Black: 16.0%
Hispanic: 69.0%
Two or more races: 2.0%
White: 7.0%

Click here for this school's ranking on GoLocalProv's Top High Schools 2013

View Larger +
Prev Next

#13 Dr. Jorge Alvarez HS

Dr. Jorge Alvarez High School, Providence, RI

Total enrollment: 563

Percentage of total enrollment

Amer Indian/Alaskan: 1.0%
Asian/Pacific Islander: 9.0%
Black: 15.0%
Hispanic: 69.0%
Two or more races: 2.0%
White: 4.0%

Click here for this school's ranking on GoLocalProv's Top High Schools 2013

View Larger +
Prev Next

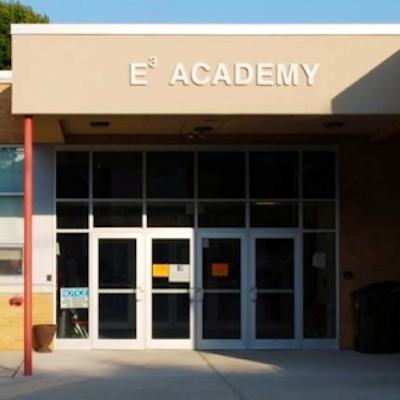
#12 E-Cubed Academy

Providence, RI

Total enrollment: 360

Percentage of total enrollment

Amer Indian/Alaskan: 1.0%
Asian/Pacific Islander: 3.0%
Black: 29.0%
Hispanic: 54.0%
Two or more races: 3.0%
White: 10.0%

Click here for this school's ranking on GoLocalProv's Top High Schools 2013

View Larger +
Prev Next

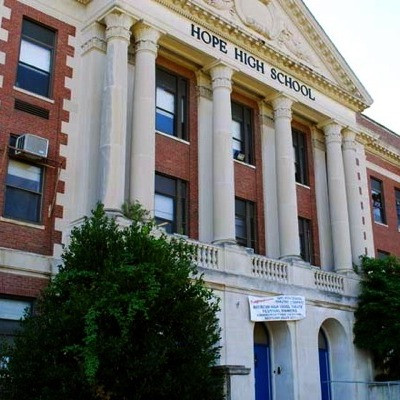
#11 Hope Arts School

Providence, RI

Total enrollment: 1,035

Percentage of total enrollment

Amer Indian/Alaskan: 1.0%
Asian/Pacific Islander: 6.0%
Black: 25.0%
Hispanic: 56.0%
Two or more races: 3.0%
White: 9.0%

Click here for this school's ranking on GoLocalProv's Top High Schools 2013

View Larger +
Prev Next

#10 Woonsocket HS

Woonsocket, RI

Total enrollment: 1,736

Percentage of total enrollment

Amer Indian/Alaskan: 0.0%
Asian/Pacific Islander: 6.0%
Black: 11.0%
Hispanic: 27.0%
Two or more races: 4.0%
White: 52.0%

Click here for this school's ranking on GoLocalProv's Top High Schools 2013

View Larger +
Prev Next

#9 Shea Senior HS

Pawtucket, RI

Total enrollment: 905

Percentage of total enrollment

Amer Indian/Alaskan: 1.0%
Asian/Pacific Islander: 1.0%
Black: 46.0%
Hispanic: 33.0%
Two or more races: 5.0%
White: 14.0%

Click here for this school's ranking on GoLocalProv's Top High Schools 2013

View Larger +
Prev Next

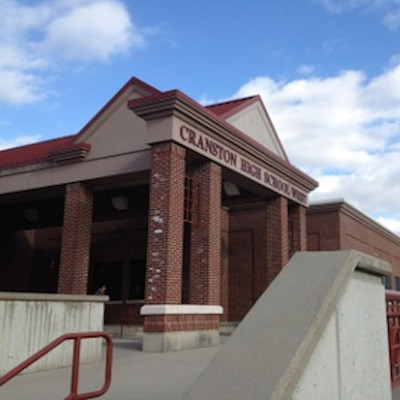
#8 Cranston HS East

Cranston, RI

Total enrollment: 1,587

Percentage of total enrollment

Amer Indian/Alaskan: 1.0%
Asian/Pacific Islander: 10.0%
Black: 7.0%
Hispanic: 32.0%
Two or more races: 4.0%
White: 47.0%

Click here for this school's ranking on GoLocalProv's Top High Schools 2013

View Larger +
Prev Next

#7 Blackstone Academy

Blackstone Academy Charter School, Pawtucket, RI

Total enrollment: 165

Percentage of total enrollment

Amer Indian/Alaskan: 0.0%
Asian/Pacific Islander: 3.0%
Black: 21.0%
Hispanic: 57.0%
Two or more races: 3.0%
White: 15.0%

Click here for this school's ranking on GoLocalProv's Top High Schools 2013

View Larger +
Prev Next

#6 Jacqueline M. Walsh

Jacqueline M. Walsh School for the Performing and Visual Arts, Pawtucket, RI

Total enrollment: 167

Percentage of total enrollment

Amer Indian/Alaskan: 0.0%
Asian/Pacific Islander: 2.0%
Black: 14.0%
Hispanic: 28.0%
Two or more races: 6.0%
White: 50.0%

Click here for this school's ranking on GoLocalProv's Top High Schools 2013

View Larger +
Prev Next

#5 Rogers HS

Newport, RI

Total enrollment: 587

Percentage of total enrollment

Amer Indian/Alaskan: 2.0%
Asian/Pacific Islander: 1.0%
Black: 25.0%
Hispanic: 20.0%
Two or more races: 3.0%
White: 49.0%

Click here for this school's ranking on GoLocalProv's Top High Schools 2013

View Larger +
Prev Next

#4 The MET School

The Metropolitan Regional Career and Technical Center, Providence, RI

Total enrollment: 868

Percentage of total enrollment

Amer Indian/Alaskan: 2.0%
Asian/Pacific Islander: 2.0%
Black: 15.0%
Hispanic: 42.0%
Two or more races: 4.0%
White: 35.0%

Click here for this school's ranking on GoLocalProv's Top High Schools 2013

View Larger +
Prev Next

#3 Davies Career & Tech

Davies Career & Technical High School, Providence, RI

Total enrollment: 833

Percentage of total enrollment

Amer Indian/Alaskan: 1.0%
Asian/Pacific Islander: 6.0%
Black: 13.0%
Hispanic: 39.0%
Two or more races: 4.0%
White: 38.0%

Click here for this school's ranking on GoLocalProv's Top High Schools 2013

View Larger +
Prev Next

#2 William E. Tolman HS

William E. Tolman Senior High School, Pawtucket, RI

Total enrollment: 1,050

Percentage of total enrollment

Amer Indian/Alaskan: 1.0%
Asian/Pacific Islander: 1.0%
Black: 18.0%
Hispanic: 37.0%
Two or more races: 6.0%
White: 37.0%

Click here for this school's ranking on GoLocalProv's Top High Schools 2013

View Larger +
Prev Next

#1 Classical HS

Providence, RI

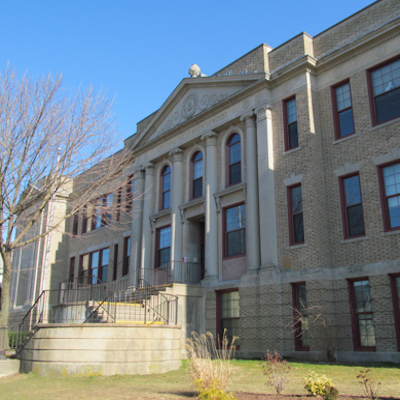
Total enrollment: 1,113

Percentage of total enrollment

Amer Indian/Alaskan: 1.0%
Asian/Pacific Islander: 9.0%
Black: 16.0%
Hispanic: 46.0%
Two or more races: 3.0%
White: 26.0%

Click here for this school's ranking on GoLocalProv's Top High Schools 2013


Enjoy this post? Share it with others.


Sign Up for the Daily Eblast

I want to follow on Twitter

I want to Like on Facebook