
Side of the Rhode: Who’s Hot and Who’s Not in RI Politics?
Friday, April 25, 2014
Every Friday, Dan Lawlor breaks down who's rising and who's falling in the world of Rhode Island politics. Check out who made the lists this week.

HOT
Mayor Donald Grebien/Pawtucket - "There are many reasons why recycling in urban areas is a challenge... However, it can be done. Pawtucket has had some impressive successes. The Pawtucket Housing Authority recently launched a successful campaign in one of their larger complexes, and have realized 100% participation in the program-unprecedented," Sarah Kite, Rhode Island Resource Recovery Corporation's Executive Director, told Kate Nagle. Good news for Mayor Grebien, and credit to Stephen A. Vadnais, the Pawtucket Housing Authority's Executive Director.
Representative Patricia Morgan - 44 states give their governors use of a line item veto. Rhode Island does not. Representative Morgan, along with Hull, Chippendale, and Giarrusso, are hoping to change that, by submitting a referendum question (H8014) to give our future governors the power to reject specific parts of bills and the budget, without vetoing the entire legislation. Will Rep Keable, Judiciary chair, let this go to the floor for a vote?
GET THE LATEST BREAKING NEWS HERE -- SIGN UP FOR GOLOCAL FREE DAILY EBLASTJohanna Harris/Providence Board of Licenses - Good work! Under Harris, this key city committee, whose five members are appointed by the Mayor and paid to serve, has greatly improved its public access, and through the past month, regularly posts its agendas and meeting minutes online. The board meets Mondays, Wednesdays and Thursdays at 1:00pm. State Senator Juan Pichardo currently serves on the board, and, while House Majority Leader, Gordon Fox served as Vice-Chairman.
Providence Student Union/Young Voices Mayoral Debate - Who wasn't there? Public transit for students, "bumping" of teachers, and the fairness of the NECAP test have become real parts of the policy conversations because students organized and demanded action. This past week, student groups Providence Student Union and Young Voices co-hosted a Mayoral debate, featuring Dr. Dan Harrop, Jorge Elorza, Brett Smiley, Lorne Adrain, Michael Solomon, and Chris Young. Karen Feldman, of Young Voices, notes, this is "totally, fully youth-run." At the last election cycle's youth forum, Angel Taveras promised to appoint a youth member to the school board. Still waiting.
Sojourner House - Sojourner House, which operates the largest largest transitional housing program in RI for families recovering from violent and abusive relationships, is asking you to, "Be 1 of 100! This March and April, our goal is to raise at least $25,000 from 100 or more people and groups who share our mission...If you're part of a group or a business that can lead a collective effort, consider organizing your colleagues or club members to fundraise together. Make it fun!" Check out the 100 campaign here, or go to a fundraiser at New Harvest Coffee and Spirits on May 1, from 7-9pm in the Arcade.
Br. Lawrence Goyette/San Miguel School - “We’d see a lot of kids roaming around at all hours, and we heard stories of how they were going nowhere in school. So we began saying, ‘Wouldn’t it be great if we could start something right here?" In the early 1990s, Br. Lawrence spear-headed the opening of the first San Miguel School here in Providence- and now dozens of these affordable independent middle schools exist across the country. Small by design, "There have never been more than 62 students for all the four grades, and that’s been a key to allowing everyone to know everybody else. It helps the kids to feel safe and loved; they understand that this place is different.” As Br. Lawrence prepares to retire, the Providence school has received a $1.1 million donation from the family of Ben Mondor, former owner of the Pawtucket Red Sox.
NOT
Mayor Angel Taveras/Providence - Following the latest staff departure, Director of Policy Toby Shepherd's announced move to the RI Foundation, the Mayor finds out that the Rhode Island Resource Recovery Corporation (RIRRC) ranked the capital city last in the state for recycling, with numerous loads rejected for contamination. Sarah Kite, RIRRC Executive Director, told GoLocal, "The cost for rejected loads will increase as of July 1, 2014, so the costs for the city will most certainly increase unless they are able to fully address the problems. The main contaminants continue to be food waste, textiles, and construction and demolition debris."
Representatives Corvese, O'Brien, Hull, Azzinaro, and Edwards - Our State Constitution has no words on how to replace a vacancy in the Lt. Governor's office. Via H7171, Corvese and Co. propose that the General Assembly, in grand committee, vote to fill the vacancy. Kudos to the group for offering a solution, but how about this: Lt. Governor runs on same ticket as Governor, and vacant statewide offices be filled by the people's choice in special elections, not the legislature's choice in special session.
$1,687,505.00 - The total number owed in fines to the State Board of Elections by candidates and elected officials for failing to file paperwork related to campaign financing and reports. Two Providence City Councilors are in the top ten (Luis Aponte and Kevin Jackson), each owing more than $40,000 in fines. Davian Sanchez is in the top 40, owing more than $9,000.
TSAs - The capital city's Tax Stabilization Agreements are coming under greater scrutiny. 36 private companies have TSAs on property with a total assessed valuation of $429.4 million; Those 36 properties paid $5.2 million in taxes in 2013. All of the TSAs are going to small budget Ma and Pa stores in the North End, Valley, and the Southside...just kidding. GTECH, Hasbro, the Waterplace Condos, the Biltmore Hotel, and the Westminster Street apartment buildings all receive big breaks. For instance, as Go Local reported, if the Peerless Lofts building on Eddy St paid its true 2013 tax rate, it would pay the city $472,006; because of the TSA, Peerless Lofts pays the city $33,407.
Media Consolidation - As GoLocal's Dean Starkman reports,"Channel 10’s parent just bought Channel 12’s parent. Does it matter? You bet it does...Left out in the cold, as usual, is the public, which relies on robust local operations reporting the news... consolidation nationally has led to a dilution of new gathering strength locally...The Wrap blog asks -- “Will Media General-LIN Merger Lead to More Local TV Job Losses?” -- but the question is pretty much rhetorical."
71% - As RI KIDS COUNT reports, Providence's Class of 2013 had a 71% four year graduation rate, with 15% dropping out entirely. At the same time, Worcester had a 73.4% four year graduation rate, with 11% dropping out. While disheartening, this is a dramatic improvement from the recent past. For perspective, Providence's Class of 2011 had a 66% four year graduation rate, with 24% dropping out. The Class of 2008 had a 63% four year graduation rate, with 26% dropping out.
Related Slideshow: RI Recycling Rates by Town - 2011 to 2013
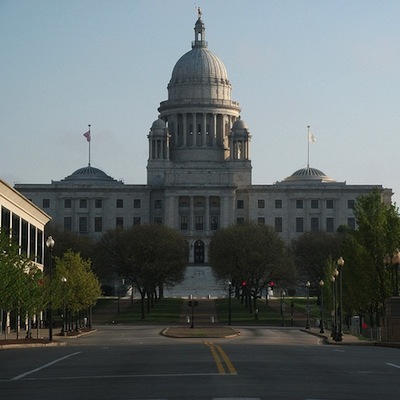


#38. Providence
#37. Johnston
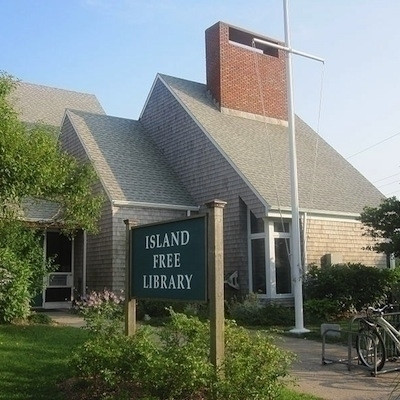
#36. New Shoreham
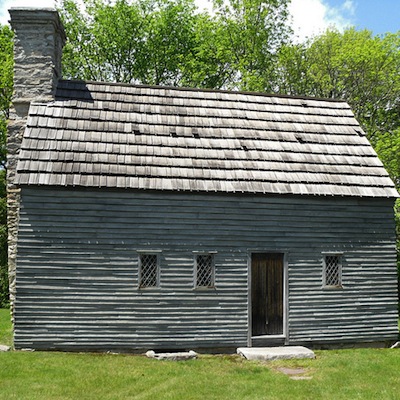
#35. Foster
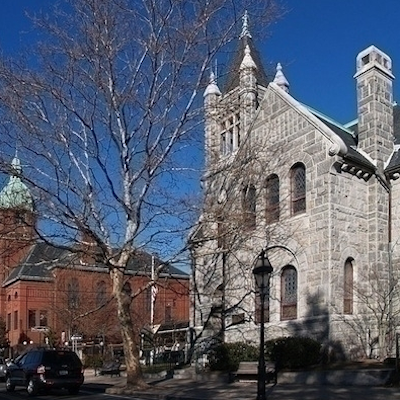
#34. Central Falls
#33. Warren
#32.Scituate
#31. Lincoln
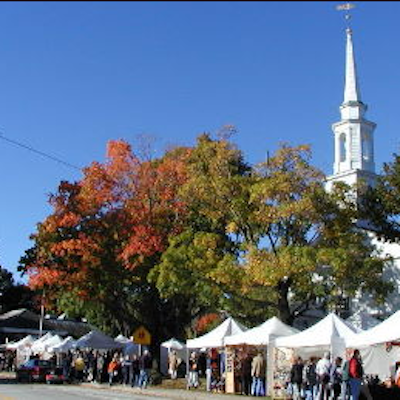
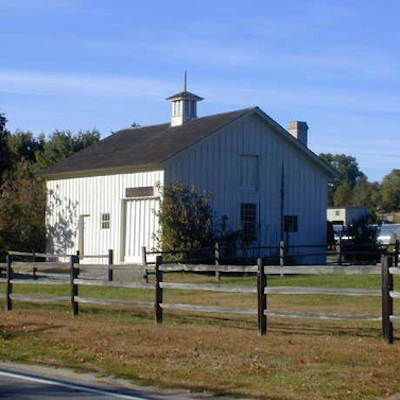
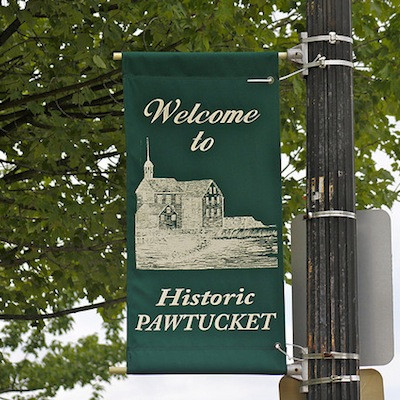
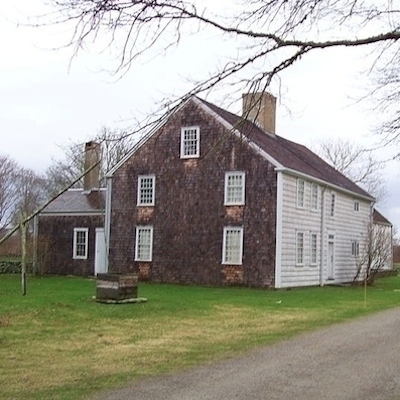
#30. Pawtucket
#29. Cumberland
#28. Little Compton
#27. Coventry
#26. West Warwick
#25. West Greenwich
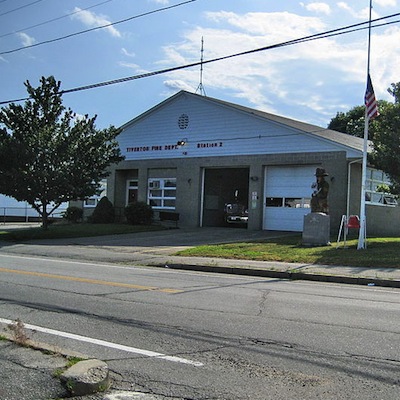
#24. Tiverton
#23. North Providence
#22. Westerly/Hopkinton-
#21. Jamestown 
#20. Woonsocket
#19. Exeter
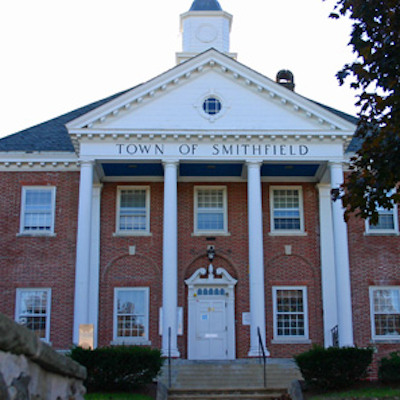
#18. Smithfield
#17. Glocester
#16. Newport
#15. Cranston
#14. Richmond
#13. Bristol
#12. Burrillville
#11. North Smithfield
#10. East Greenwich
#9. Narragansett
#8. Charlestown
#7. North Kingstown
#6. East Providence
#5. Warwick
#4. Portsmouth
#3. Barrington
#2. Middletown
#1. South Kingstown
Related Articles
- PODCAST: Side of the Rhode: Who’s Hot and Who’s Not in RI Politics
- Side of the Rhode: Who’s Hot and Who’s Not in RI Politics
- Side of the Rhode: Who’s Hot and Who’s Not in RI Politics?
- Side of the Rhode: Who’s Hot and Who’s Not in RI Politics?
- Side of the Rhode: Who’s Hot and Who’s Not in RI Politics?
- Side of the Rhode: Who’s Hot and Who’s Not in RI Politics?
- Side of the Rhode: Who’s Hot and Who’s Not in RI Politics?
- Side of the Rhode: Who’s Hot and Who’s Not in RI Politics?
- Side of the Rhode: Who’s Hot and Who’s Not in RI Politics?
- Side of the Rhode: Who’s Hot and Who’s Not in RI Politics?
- Side of the Rhode: Who’s Hot and Who’s Not in RI Politics?
- Side of the Rhode: Who’s Hot and Who’s Not in RI Politics?
- Side of the Rhode: Who’s Hot and Who’s Not in RI Politics?
- Side of the Rhode: Who’s hot and who’s not in RI politics
- Side of the Rhode: Who’s hot and who’s not in Rhode Island politics?
- Side of the Rhode: Who’s Hot and Who’s Not in RI Politics?
- Side of the Rhode: Who’s Hot and Who’s Not in RI Politics?
- Side of the Rhode: Who’s Hot and Who’s Not in RI Politics?
- Side of the Rhode: Who’s Hot and Who’s Not in RI Politics?
- Side of the Rhode: Who’s Hot and Who’s Not in RI Politics?
- Side of the Rhode: Who’s Hot and Who’s Not in RI Politics?
- Side of the Rhode: Who’s Hot and Who’s Not in RI Politics?
- Side of the Rhode: Who’s Hot and Who’s Not in RI Politics?
- Side of the Rhode: Who’s Hot and Who’s Not in RI Politics?
- Side of the Rhode: Who’s Hot and Who’s Not in RI Politics?
- Side of the Rhode: Who’s Hot and Who’s Not in RI Politics?
- Side of the Rhode
- Side of the Rhode: Who’s Hot and Who’s Not in RI Politics
- Side of the Rhode: Who’s Hot and Who’s Not in RI Politics?
- Side of the Rhode: Who’s Hot and Who’s Not in RI Politics?
- Side of the Rhode: Who’s Hot and Who’s Not in RI Politics?
- Side of the Rhode: Who’s Hot and Who’s Not in RI Politics?
- Side of the Rhode: Who’s Hot and Who’s Not in RI Politics?
- Side of the Rhode: Who’s Hot and Who’s Not in RI Politics?
- Side of the Rhode: Who’s Hot and Who’s Not in RI Politics?
- Side of the Rhode: Who’s Hot and Who’s Not in RI Politics?
- Side of the Rhode: Who’s Hot and Who’s Not in RI Politics?
- Side of the Rhode: Who’s Hot and Who’s Not in RI Politics?
- Side of the Rhode: Who’s Hot and Who’s Not in RI Politics?
- Side of the Rhode: Who’s hot and who’s not in RI politics?
- Side of the Rhode: Who’s hot and who’s not in Rhode Island politics?
- Side of the Rhode: Who’s Hot and Who’s Not in RI Politics?
- Side of the Rhode: Who’s Hot and Who’s Not in RI Politics?
- Side of the Rhode: Who’s Hot and Who’s Not in RI Politics?
- Side of the Rhode: Who’s Hot and Who’s Not in RI Politics?
- Side of the Rhode: Who’s Hot and Who’s Not in RI Politics?
- Side of the Rhode: Who’s Hot and Who’s Not in RI Politics?
- Side of the Rhode: Who’s Hot and Who’s Not in RI Politics?
- Side of the Rhode: Who’s Hot and Who’s Not in RI Politics?
- Side of the Rhode: Who’s Hot and Who’s Not in RI Politics?
- Side of the Rhode: Who’s Hot and Who’s Not in RI Politics?
- Side of the Rhode: who’s hot and who’s not in RI?
- Side of the Rhode - Who’s Hot and Who’s Not in RI Politics
- Side of the Rhode: Who’s Hot and Who’s Not in RI Politics
- Side of the Rhode: Who’s Hot and Who’s Not in RI Politics?
- Side of the Rhode: Who’s Hot and Who’s Not in RI Politics?
- Side of the Rhode: Who’s Hot and Who’s Not in RI Politics?
- Side of the Rhode: Who’s Hot and Who’s Not in RI Politics?
- Side of the Rhode: Who’s Hot and Who’s Not in RI Politics?
- Side of the Rhode: Who’s Hot and Who’s Not in RI Politics?
- Side of the Rhode: Who’s Hot and Who’s Not in RI Politics?
- Side of the Rhode: Who’s Hot and Who’s Not in RI Politics?
- Side of the Rhode: Who’s Hot and Who’s Not in RI Politics?
- Side of the Rhode: Who’s Hot and Who’s Not in RI Politics?
- Side of the Rhode: Who’s Hot and Who’s Not in RI Politics?
- Side of the Rhode: Who’s hot and who’s not in RI politics?
- Side of the Rhode: Who’s Hot and Who’s Not in RI Politics?
- Side of the Rhode: Who’s Hot and Who’s Not in RI Politics?
- Side of the Rhode: Who’s Hot and Who’s Not in RI Politics?
- Side of the Rhode: Who’s Hot and Who’s Not in RI Politics?
- Side of the Rhode: Who’s Hot and Who’s Not in RI Politics?
- Side of the Rhode: Who’s Hot and Who’s Not in RI Politics?
- Side of the Rhode: Who’s Hot and Who’s Not in RI Politics?
- Side of the Rhode: Who’s Hot and Who’s Not in RI Politics?
- Side of the Rhode: Who’s Hot and Who’s Not in RI Politics?
- Side of the Rhode: Who’s Hot and Who’s Not in RI Politics?
- Side of the Rhode: Who’s Hot and Who’s Not in RI Politics?
- Side of the Rhode: who’s hot and who’s not in RI?
- Side of the Rhode: Who’s HOT and Who’s NOT in RI Politics
- Side of the Rhode: Who’s Hot and Who’s Not in RI Politics
- Side of the Rhode: Who’s Hot and Who’s Not in RI Politics?
- Side of the Rhode: Who’s Hot and Who’s Not in RI Politics?
- Side of the Rhode: Who’s Hot and Who’s Not in RI Politics?
- Side of the Rhode: Who’s Hot and Who’s Not in RI Politics?
- Side of the Rhode: Who’s Hot and Who’s Not in RI Politics?
- Side of the Rhode: Who’s Hot and Who’s Not in RI Politics?
- Side of the Rhode: Who’s Hot and Who’s Not in RI Politics?
- Side of the Rhode: Who’s Hot and Who’s Not in RI Politics?
- Side of the Rhode: Who’s Hot and Who’s Not in RI Politics?
- Side of the Rhode: Who’s Hot and Who’s Not in RI Politics?
- Side of the Rhode: Who’s Hot and Who’s Not in Rhode Island Politics
- Side of the Rhode: Who’s hot and who’s not in RI politics?
- Side of the Rhode: Who’s Hot and Who’s Not in RI Politics?
- Side of the Rhode: Who’s Hot and Who’s Not in RI Politics?
- Side of the Rhode: Who’s Hot and Who’s Not in RI Politics?
- Side of the Rhode: Who’s Hot and Who’s Not in RI Politics?
- Side of the Rhode: Who’s Hot and Who’s Not in RI Politics?
- Side of the Rhode: Who’s Hot and Who’s Not in RI Politics?
- Side of the Rhode: Who’s Hot and Who’s Not in RI Politics?
- Side of the Rhode: Who’s Hot and Who’s Not in RI Politics?
