Michael Riley: The Pension Study Commission Needs To Face Reality
Tuesday, February 18, 2014
Michael G. Riley, GoLocalProv MINDSETTER™
 View Larger +
Moody's adjustments will yield numbers vastly different from the ones taxpayers have been shown.
There is a great deal of media buzz surrounding Friday’s press conference, considering the settlement amounts to just a little over $240 million. Friday’s announced state settlement cost taxpayers an average of $609 per household. Rhode Island leaders and taxpayers should quickly move on and focus their efforts on the real crisis: the avalanche of debt immediately ahead for cities and towns.
For many taxpayers in Rhode Island, the $609 per household is relatively insignificant. Compare that $609 to the predicament of Providence citizens, for example, who face an increase of over $8,229 per household in the next year in pension liability alone. This is real and will be evident once Moody’s adjusts Mayor Taveras fantasy numbers to reality. Even Providence‘s city-hired auditor points out that $57.3 million in inappropriate assets were claimed in the pension plan. The actuary points this out in Section 1, points 2 and 3 … “We recommend future valuation of plan assets exclude discounted contributions from reported assets. “ Ouch.
Whoops, the auditor just said planned assets were overstated by $57.3 million. No one in the mainstream media apparently reads these reports or does real analysis. Where was Politifact? Taveras hopes and expects the rest of the RI media to just ignore this adjustment, as well as the pending proper liability adjustment of an increased $506 million and total unfunded liability of $1.338 billion (which will be published and verified after this November 2014 elections). He obviously intends to mislead citizens until the inevitable reality hits.
GET THE LATEST BREAKING NEWS HERE -- SIGN UP FOR GOLOCAL FREE DAILY EBLAST
In hot water
There are basically two RI government jurisdictions providing public sector employment. Citizens are taxed at both the state level and at the local level to pay the wages and benefits of public employees. Several towns have merged their local pension plans into the state system and so on Friday, it appears that the hike in liability to those taxpayers in merged towns will be constrained to the agreed upon cost.
However, many cities and towns still run their own local Defined Benefit Pension Plans and those taxpayers are vulnerable to much higher liability. The 17 “critical status” towns alone owe more than $2.2 billion in pension debt. In addition, nearly every city and town carries an OPEB liability, which is basically the unfunded liability due to health care benefits and other benefits. Town leaders bargained future health care coverage for public employees, yet never funded the obligation. These OPEB liabilities totaled $3.56 billion according to a report issued by the RI State Auditor General Dennis Hoyle (a pension commission member).
State settlement insignificant relative to local debt issues
Several other towns in Rhode Island have the same issue as Providence (while not of the same magnitude). They are large and the increases in liability that will appear due to more accurate accounting will dwarf the cost per household of this highly hyped state settlement. Comparatively, the state settlement is literally a drop in the bucket. I have not yet heard a plan for the cities and towns from the gubernatorial candidates. So far, of all the candidates, Mayor Fung seems most concerned about the local issue and has criticized the lack of focus for years now. Ms. Raimondo dropped the city and town fixes in her legislative effort because it was too hard to address.
So what are Providence, Pawtucket, West Warwick, Coventry, Cranston, etc. supposed to do? Are they on their own? Is the Pension Study Commission, now years old, supposed to do anything other than collect data? Does anyone think that the taxpayers in Central Coventry Fire District care more about the $609, or the $30,000+ per household the recent CCFD liquidation reportedly represents?
A looming $30,000 liability will crush local real estate prices, producing a downward spiral in assessment and tax collection. This dynamic is known as the “Detroit syndrome”. Citizens should try to avoid being trapped in this spiral at all costs, but this contagion is just around the corner, and Moody’s will judge all towns more harshly. It begins soon by lowering the discount rates, which are arbitrarily chosen by each town (Providence’s is 8.25%) to a standard 6% so we can compare towns across the United States. Additionally, Moody's has declared that they are doubling the weighing of pension and OPEB under-funding in municipal rating decisions. If a local pension fund is deeply underfunded, then those towns can expect an even lower discount rate—perhaps as low as 4%. Rhode Island stands out like a sore thumb compared to all other localities across the country in the number of local pension plans under 50% funded.
In short, we have a real crisis that may not have 14 more months of “analysis and negotiation“ before this situation spins completely out of control. Which leaders will address this? When can we get a “real” pension commission? Has Chafee now finished and will he defend his 38 Studios actions for the rest of the term, or can he actually pitch in and work to help this crisis? Why doesn’t he involve himself in Coventry, or West Warwick? How about a commission that at least standardizes discount rates and adheres to rating agencies’ reality? Are they really saying Providence is fine at $8.25%? Is it too much to ask for a single metric? All we ask is that the commission tell us the truth and their plans to fix it.
Michael G. Riley is vice chair at Rhode Island Center for Freedom and Prosperity, and is managing member and founder of Coastal Management Group, LLC. Riley has 35 years of experience in the financial industry, having managed divisions of PaineWebber, LETCO, and TD Securities (TD Bank). He has been quoted in Barron’s, Wall Street Transcript, NY Post, and various other print media and also appeared on NBC news, Yahoo TV, and CNBC.
Related Slideshow: New England Communities With the Most Political Clout 2013
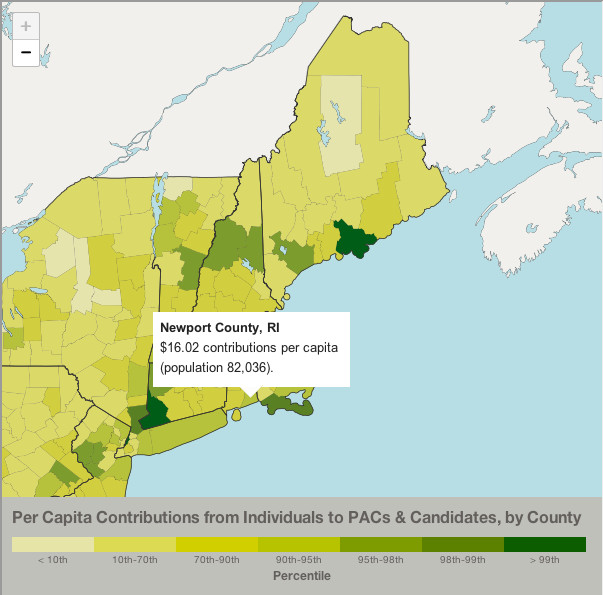
The Sunlight Foundation, in conjunction with Azavea, released data maps this week showing political contribution dollars to federal elections dating back to 1990 -- by county.
GoLocal takes a look at the counties in New England that had the highest per-capita contributions in the 2012 election cycle -- and talked with experts about what that meant for those areas in New Engand, as well as the candidates.
_400_395_90.jpg) View Larger +
View Larger +
Prev
Next
25. Merrimack County, NH
Contributions, per capita, 2012: $9.86
Total contributions: $1,447,713
Merrimack County is named after the Merrimack River and is home to the states capital, Concord. Merrimack County has a total area of 956 square miles and a population of 146,761.
 View Larger +
Prev
Next
24. Cheshire County, NH
Contributions, per capita, 2012: $9.88
Total contributions: $759,209
Cheshire is one of the five original counties in New Hampshire and was founded in 1771. The highest point in Cheshire County is located at the top of Mount Monadnock, which was made famous by the poets Ralph Waldo Emerson and Henry David Thoreau.
 View Larger +
Prev
Next
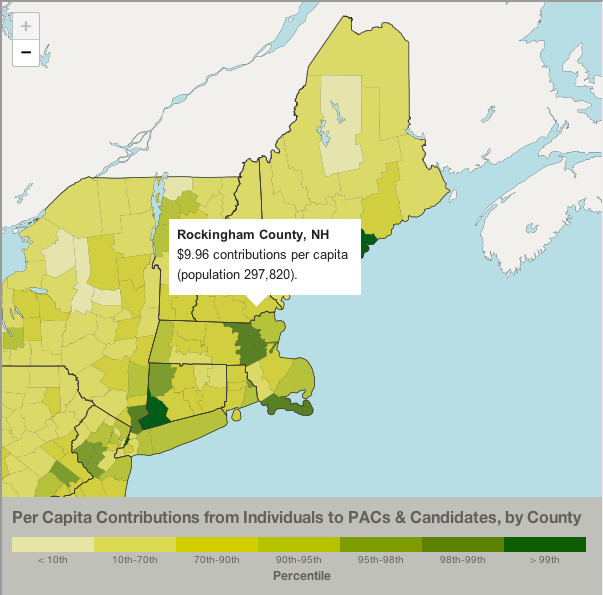
23. Rockingham County, NH
Contributions, per capita, 2012: $9.96
Total contributions: $2,965,530
Rockingham has 37 communities and has a population of 297,820. Rockingham County also was home to the famous poet, Robert Frost
 View Larger +
Prev
Next
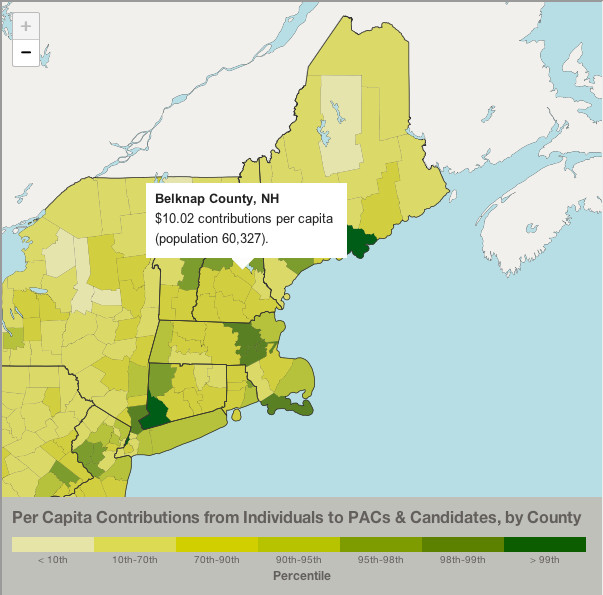
22. Belknap County, NH
Contributions, per capita, 2012: $10.02
Total contributions: $604,512
Belknap County is one of the ten counties in New Hampshire and has a population of 60,327. It is located in the center of New Hampshire and the largest city is Laconia.
 View Larger +
Prev
Next
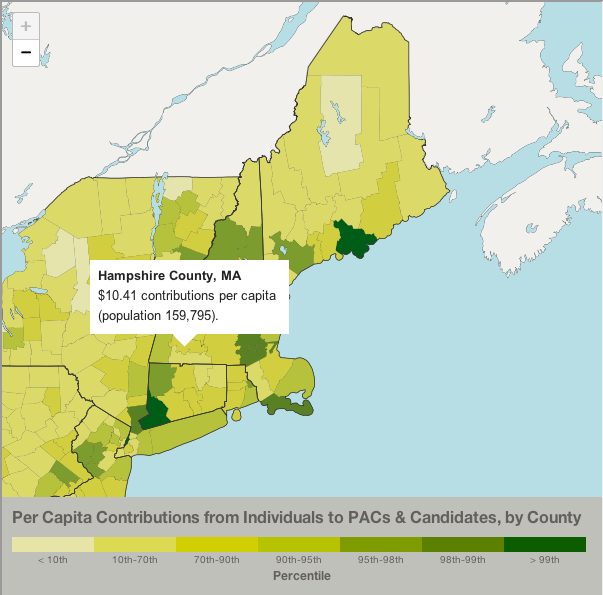
21. Hampshire County, MA
Contributions, per capita, 2012: $10.41
Total contributions: $1,664,077
Hampshire County has a total area of 545 square miles and is located in the middle of Massachusetts. Hampshire County is also the only county to be surrounded in all directions by other Massachusetts counties.
 View Larger +
Prev
Next
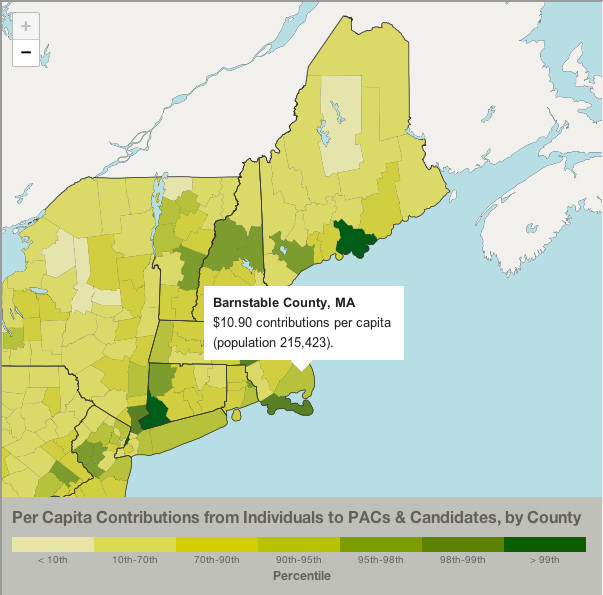
20. Barnstable County, MA
Contributions, per capita, 2012: $10.90
Total contributions: $2,348,541
Barnstable County was founded in 1685 and has three national protected areas. Cape Cod National Seashore is the most famous protected area within Barnstable County and brings in a high amount of tourists every year.
 View Larger +
Prev
Next
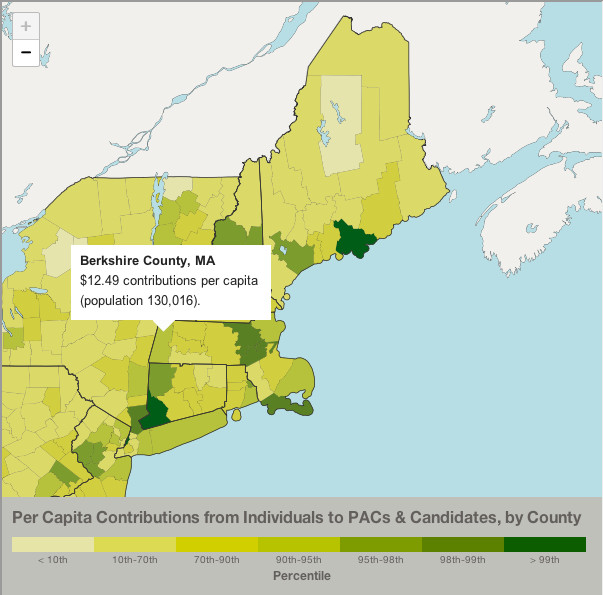
19. Berkshire County, MA
Contributions, per capita, 2012: $12.49
Total contributions: $1,624,400
Berkshire County is located on the western side of Massachusetts and borders three different neighboring states. Originally the Mahican Native American Tribe inhabited Berkshire County up until the English settlers arrived and bought the land in 1724.
 View Larger +
Prev
Next
18. Essex County, MA
Contributions, per capita, 2012: $13.22
Total contributions: $9,991,201
Essex is located in the northeastern part of Massachusetts and contains towns such as Salem, Lynn, and Andover. Essex was founded in 1643 and because of Essex historical background, the whole county has been designated as the Essex National Heritage Area.
 View Larger +
Prev
Next
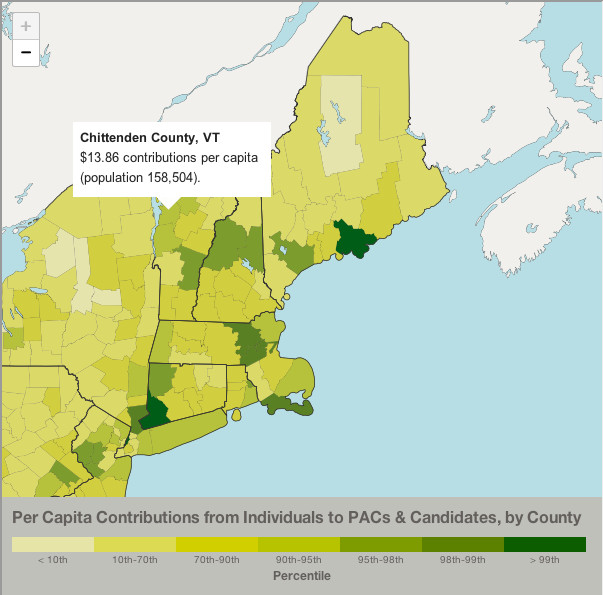
17. Chittendon County, VT
Contributions, per capita, 2012: $13.86
Total contributions: $2,196,107
Chittenden has a population of 158,504, making it Vermont’s most populated county. Chittenden’s largest city is Burlington, which has about one third of Vermont’s total population.
 View Larger +
Prev
Next
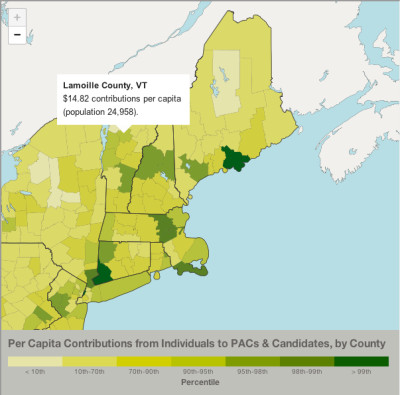
16. Lamoille County, VT
Contributions, per capita, 2012: $14.82
Total contributions: $369,854
Lamoille County was founded in 1835 and has a population of 24,958. The county has 464 square miles, of which 461 of them are land.
 View Larger +
Prev
Next
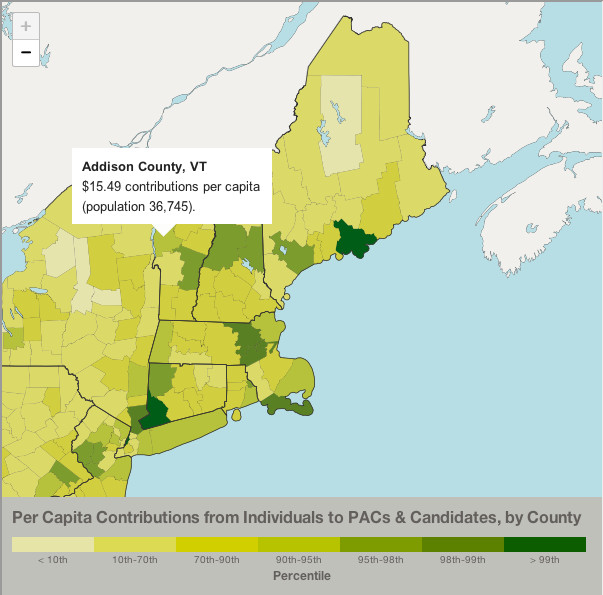
15. Addison County, VT
Contributions, per capita, 2012: $15.49
Total contributions: $569,299
Located on the west side of Vermont, Addison County has a total area of 808 square miles. Addison's largest town is Middlebury, where the Community College of Vermont and Middlebury College are located.
 View Larger +
Prev
Next
14. Newport County, RI
Contributions, per capita, 2012: $16.02
Total contributions: $1,214,26
Newport County is one of the five Rhode Island Counties and was founded in 1703. Just like Connecticut, none of Rhode Island counties have an any governmental functions.
 View Larger +
Prev
Next
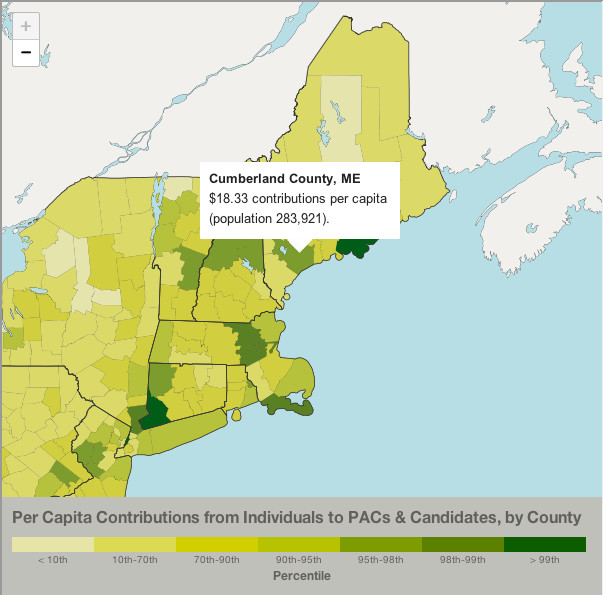
13. Cumberland County, ME
Contributions, per capita, 2012: $18.33
Total contributions: $5,205,507
Cumberland County has a population of 283,921 and is Maine’s most populated county. The county was named after the William, Duke of Cumberland, a son of King George II.
 View Larger +
Prev
Next
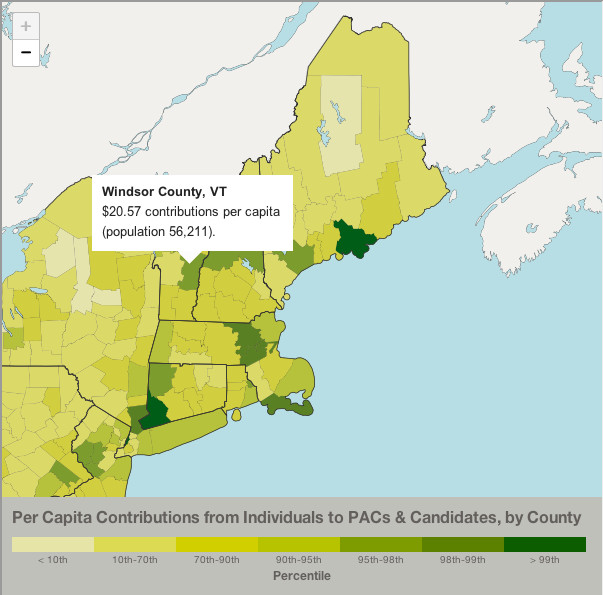
12. Windsor County, VT
Contributions, per capita, 2012: $20.57
Total contributions: $1,156,149
Windsor County is the largest county in Vermont and consists of 971 square miles of land and 5 square miles of water.
 View Larger +
Prev
Next
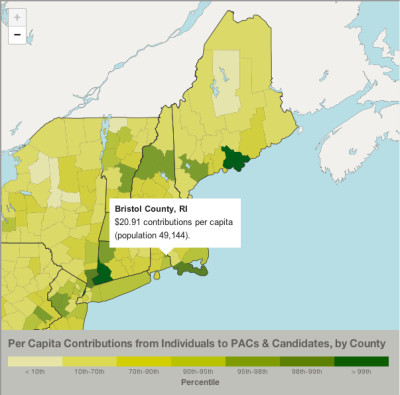
11. Bristol County, RI
Contributions, per capita, 2012: $20.91
Total contributions: $1,027,472
Bristol County has a population of 49,144 and is the third smallest county in the United States. Bristol County was originally apart of Massachusetts, but was transferred to Rhode Island in 1746.
 View Larger +
Prev
Next
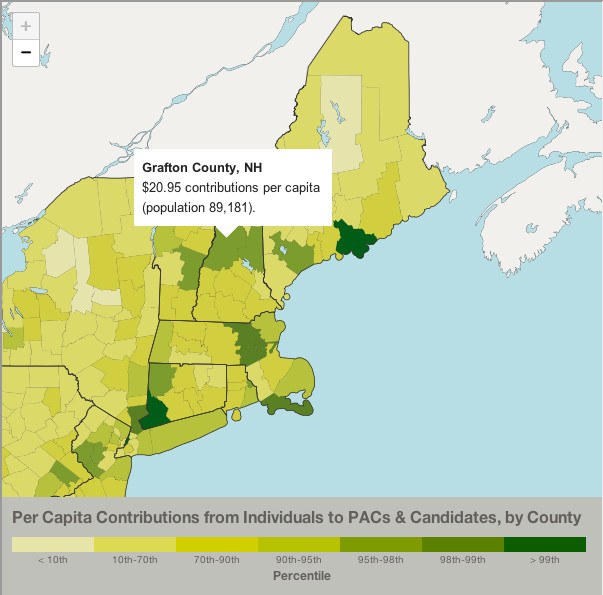
10. Grafton County, NH
Contributions, per capita, 2012 :$20.95
Total contributions: $1,868,739
With a population of 89,181, Grafton County is the second largest county in New Hampshire. Home of New Hampshire’s only national forest, White Mountain National Forest takes up about half of Grafton’s total area
 View Larger +
Prev
Next
9. Carrol County, NH
Contributions, per capita, 2012: 2012: $22.81
Total contributions: $1,012,10
Created in 1840, Carroll County has a population of 47,567. Carroll County was also named after Charles Carroll, the last surviving signer of the United States Declaration of Independence.
 View Larger +
Prev
Next
8. LItchfield County, CT
Contributions, per capita, 2012: $22.86
Total contributions: $4,286,143
Although it is Connecticut’s largest county, Litchfield has the lowest population density in all of Connecticut. Since 1960 all Connecticut counties have no county government.
_400_395_90.jpg) View Larger +
View Larger +
Prev
Next
7. Middlesex County, MA
Contributions, per capita, 2012: $32.81
Total contributions: $50,432,154
Middlesex County has a population of 1,503,085 and has been ranked as the most populous county in New England. The county government was abolished in 1997, but the county boundaries still exists for court jurisdictions and other administrative purposes.
 View Larger +
Prev
Next
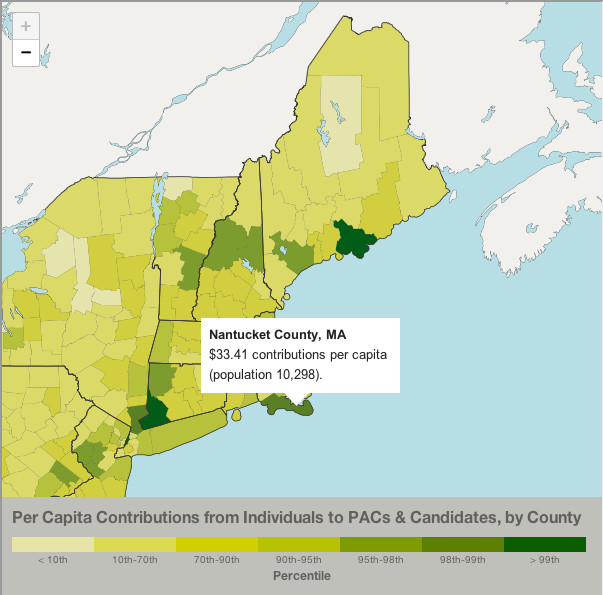
6. Nantucket County, MA
Contributions, per capita, 2012: $33.41
Total contributions: $344,021
Nantucket County consists of a couple of small islands and is a major tourist destination in Massachusetts. Normally Nantucket has a population of 10,298, but during the summer months the population can reach up to 50,000.
 View Larger +
Prev
Next
5. Norfolk County, MA
Contributions, per capita, 2012: $35.87
Total contributions: $24,459,854
Named after a county from England, Norfolk County is the wealthiest county in Massachusetts. As of 2011, Norfolk was ranked the 32nd highest income county in the United States.
 View Larger +
Prev
Next
4. Dukes County, MA
Contributions, per capita, 2012: $36.32
Total contributions: $618,960
Consisting of Martha’s Vineyard and the Elizabeth Islands, Dukes County is one of Massachusetts’ top vacation spots. Originally Dukes County was apart New York, however it was transferred to Massachusetts on October 7, 1691.
 View Larger +
Prev
Next
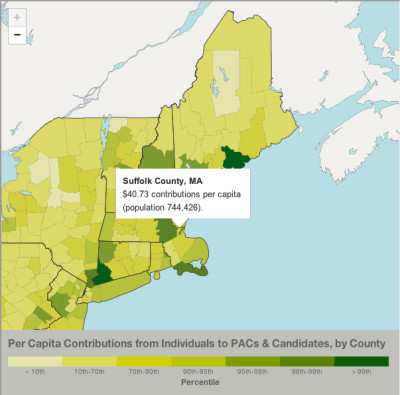
3. Suffolk County, MA
Contributions, per capita, 2012: $40.73
Total contributions: $30,323,537
Suffolk County has a population of 744,426 and contains Massachusetts’s largest city, Boston. Although Suffolk’s county government was abolished in the late 1900’s, it still remains as a geographic area.
 View Larger +
Prev
Next
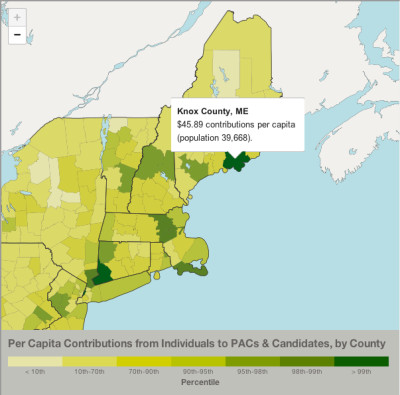
2. Knox County, ME
Contributions, per capita, 2012: $45.89
Total contributions: $1,820,410
Knox County was established on April 1st, 1860 and was named after American Revolutionary War General Henry Knox. The county has a population of 39,668 and is the home of the Union Fair.
 View Larger +
Prev
Next
1. Fairfield County, CT
Contributions, per capita, 2012: $55.65.
Total contributions: $51,970,701
In a population of 933,835, Fairfield County is the most densely populated county in Connecticut, and contains four of the state's largest cities -- Bridgeport, Stamford, Norwalk and Danbury.
Related Articles
Enjoy this post? Share it with others.


_603_595_90.jpg)


_508_502_90.jpg)