Meet the Candidates: Mike Smith
Tuesday, October 04, 2016
GoLocalProv Political Team
 View Larger +
Meet the Candidates: Mike Smith
Meet the candidates this election year. GoLocal is featuring the candidates for General Assembly, those running for Mayor in cities across the state, and the Congressional candidates. This feature allows each candidate the opportunity to express their views on the issues. Meet candidate Mike Smith. He is running in House District 75.
1. What do you think is the biggest political issue this campaign season in Rhode Island?
JOBS AND THE ECONOMY. Jobs are leaving and paychecks are stagnant as RI ranks at the bottom of almost every economic indicator. Youth are leaving our state for better opportunities in more economically diverse states. Specifically, for my District 75 Newport, it is moving beyond just focusing on tourism and moving into a “year-round ‘economy. We have opportunities to become this by diversifying and seeking high tech and startup business. However, my opponent Lauren Carson and the current leadership have brought our state to its knees as RI has fallen to the bottom as 50th Worst State for Business.
GET THE LATEST BREAKING NEWS HERE -- SIGN UP FOR GOLOCAL FREE DAILY EBLAST
2. What do we need to do to improve Rhode Island's economy?
As a small business owner that does business all over the country I can attest that Rhode Island nationally has a perception as a rotten state to do business. We can and must move beyond this perception, which unfortunately is based in facts. First is opening our state up for business. An aggressive campaign similar to what New York State did. When elected I will propose “Startup RI “, which will attract new, fresh, startup business. Waiving the corporation fee, simplifying the red tape, tax breaks, using old or un-used buildings as business incubators or hubs, and much more. If we can put the power back in the people’s hands, they will generate new small business which will employ people and generate revenue. On the other side is education. Much of our bad economic rankings are that we do not have a prepared -educated workforce. Business is passing us by because of this. We continue to fall despite high spending. We need to encourage STEAM education goals, vocational schools that teach a trade, and encourage school choice, as well as charter schooling. Our current leadership and my opponent offer no new ideas for the economy other than further taxes, tolls, and fees on the backs of taxpayers.
3. What is the greatest challenge facing Rhode Island as a state?
Status Quo. Right now are state is being bled dry because of career politicians who lack vision and creativity to get Rhode Island out of last place in so many economic indicators. The business and jobs situation is a cancer spreading rapidly throughout our state, as revenues are drying up, even for social programs, and other state needs. Families are leaving. While all this is occurring the House is buried in endless scandals. Bottom line, there is a lack of urgency for the what is ahead for us and our kids. My opponent , who voted 99% with leadership and our current group of politicians have turned the tables, and they feel they are the master and the voter is the servant. This status- quo has to be broken in this next election.
4. Why are you running for office?
As a father of three, and a small business owner, I am watching the state I love disappearing. The last few years my opponent and the leadership have imposed absolute havoc on the citizens of Rhode Island. The corruption and arrogance has caused many Rhode Islanders to lose heart and hope for our state. Our embarrassing rankings not just in economic indicators, but also the falling of education, the rising of our cost of living, and the diminishing of our standard of living. We must attract new business: We have great ports, great culture to offer, and we have a great geographic location right between the two powerful cities of Boston and New York. It is shameful that we are at the bottom competing with remote states. For the same reason I ran against Senate President Paiva Weed two years ago, I want to play a part in restoring our state, so my kids can grow up here, and raise their families.
5. Who is your inspiration?
I was on the fence weather I wanted to run again. The last election was so close. I took on the Senate president, and with hardly any money got to 46% of the vote.
However, this changes when Representative Patricia Morgan’s microphone was shut off by now disgraced Ray Gallison.
That action by the majority party was a call to arms for me. It showed me that the people of this state had no voice and that they arrogantly had no shame in trying to silence it. Again, the servant is now the master, and Rhode Island is becoming a totalitarian island separating itself for the rest of the states. So again, Rep. Patricia Morgan is a hero to me and so many in the state that feel they have no voice.
Related Slideshow: The Wealth Gap in RI Cities and Towns
The below slides list the most financially unequal cities and towns in Rhode Island, in order of least to most unequal. For each community, the percent of residents at the very bottom and the very top of the income scale are listed. In addition, the median income, which is the amount made by those in the middle, and the percent of those at the median are also provided for each community. The degree of inequality is measured by comparing the combined percent of those at the top and bottom with the percent of those in the middle. If the total percent of those at the top and bottom exceeds that for the middle, the community is has greater financial inequality than the one where most income earners are in the middle. Scores above 1 indicate greater financial inequality. Scores below 1 indicate less.
 View Larger +
Prev
Next
39.
Hopkinton
Percent earning under $14,999: 5.0%
Percent earning over $150,000: 9.4%
Median income: $67,022
% in Median bracket: 23.6%
Inequality Score: 0.00
Score Key: Figures above 1 correspond to more inequality. Scores under 1 mean communities are more equal.
 View Larger +
Prev
Next
38.
Charlestown
Percent earning under $14,999: 6.0%
Percent earning over $150,000: 9.8%
Median income: $69,349
% in Median bracket:19.5%
Inequality Score: 0.81
Score Key: Figures above 1 correspond to more inequality. Scores under 1 mean communities are more equal.
 View Larger +
Prev
Next
37.
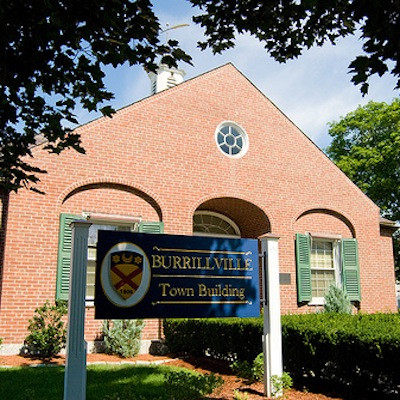
Burrillville
Percent earning under $14,999: 8.1%
Percent earning over $150,000: 9.6%
Median income: $62,188
% in Median bracket: 20.7%
Inequality Score: 0.86
Score Key: Figures above 1 correspond to more inequality. Scores under 1 mean communities are more equal.
 View Larger +
Prev
Next
36.
Warwick
Percent earning under $14,999: 9.5%
Percent earning over $150,000: 9.1%
Median income: $62,295
% in Median bracket: 21.2%
Inequality Score: 0.88
Score Key: Figures above 1 correspond to more inequality. Scores under 1 mean communities are more equal.
 View Larger +
Prev
Next
35.
Coventry
Percent earning under $14,999: 9.0%
Percent earning over: $150,000: 9.2%
Median income: $65,565
% in Median bracket: 20.1%
Inequality Score: 0.91
Score Key: Figures above 1 correspond to more inequality. Scores under 1 mean communities are more equal.
 View Larger +
Prev
Next
34.
Foster
Percent earning under $14,999: 4.2%
Percent earning over $150,000:17.4%
Median income: $81,651
% in Median bracket: 23.5%
Inequality Score: 0.92
Score Key: Figures above 1 correspond to more inequality. Scores under 1 mean communities are more equal.
 View Larger +
Prev
Next
33.
Glocester
Percent earning under $14,999: 4.8%
Percent earning over $150,000: 11.6%
Median income: $80,942
% in Median bracket: 17.7%
Inequality Score: 0.93
Score Key: Figures above 1 correspond to more inequality. Scores under 1 mean communities are more equal.
 View Larger +
Prev
Next
32.
North Providence
Percent earning under $14,999: 13.1%
Percent earning over $150,000: 5.8%
Median income: $51,470
% in Median bracket: 19.6%
Inequality Score: 0.96
Score Key: Figures above 1 correspond to more inequality. Scores under 1 mean communities are more equal.
 View Larger +
Prev
Next
31.
Westerly
Percent earning under $14,999: 7.9%
Percent earning over $150,000: 11.5%
Median income: $60,532
% in Median bracket:18.5%
Inequality Score: 1.05
Score Key: Figures above 1 correspond to more inequality. Scores under 1 mean communities are more equal.
 View Larger +
Prev
Next
30.
New Shoreham
Percent earning under $14,999: 3.8 %
Percent earning over $150,000: 20.7%
Median income: $90,491
% in Median bracket: 23.0%
Inequality Score: 1.07
Score Key: Figures above 1 correspond to more inequality. Scores under 1 mean communities are more equal.
 View Larger +
Prev
Next
29.
Warren
Percent earning under $14,999: 11.3%
Percent earning over $150,000: 9.3%
Median income: $54,295
% in Median bracket: 18.8%
Inequality Score: 1.10
Score Key: Figures above 1 correspond to more inequality. Scores under 1 mean communities are more equal.
 View Larger +
Prev
Next
28.
Smithfield
Percent earning under $14,999: 5.2%
Percent earnng over $150,000: 16.0%
Median income: $74,000
% in Median bracket: 19.3%
Inequality Score: 1.10
Score Key: Figures above 1 correspond to more inequality. Scores under 1 mean communities are more equal.
 View Larger +
Prev
Next
27.
West Greenwich
Percent earning under $14,999: 2.9%
Percent earning over $150,000: 17.1%
Median income: $78,438
% in Median bracket: 18.1%
Inequality Score: 1.10
Score Key: Figures above 1 correspond to more inequality. Scores under 1 mean communities are more equal.
 View Larger +
Prev
Next
26.
Richmond
Percent earning under $14,999: 4.5%
Percent earning over $150,000: 20.2%
Median income: $93,975
% in Median bracket: 22.2%
Inequality Score: 1.11
Score Key: Figures above 1 correspond to more inequality. Scores under 1 mean communities are more equal.
 View Larger +
Prev
Next
25.
West Warwick
Percent earning under $14,999: 14.5%
Percent earning over $150,000: 4.4%
Median income: $50,590
% in Median bracket: 16.4%
Inequality Score: 1.15
Score Key: Figures above 1 correspond to more inequality. Scores under 1 mean communities are more equal.
 View Larger +
Prev
Next
24.
Middletown
Percent earning under $14,999: 9.2%
Percent earning over $150,000: 13.8%
Median income: $69,784
% in Median bracket: 19.3%
Inequality Score: 1.19
Score Key: Figures above 1 correspond to more inequality. Scores under 1 mean communities are more equal.
 View Larger +
Prev
Next
23.
Cranston
Percent earning under $14,999: 10.8%
Percent earning over $150,000: 9.6%
Median income: $60,283
% in Median bracket: 17.1%
Inequality Score: 1.19
Score Key: Figures above 1 correspond to more inequality. Scores under 1 mean communities are more equal.
 View Larger +
Prev
Next
22.
Tiverton
Percent earning under $14,999: 7.7%
Percent earning over $150,000: 11.6%
Median income: $73,085
% in Median bracket: 15.6%
Inequality Score: 1.24
Score Key: Figures above 1 correspond to more inequality. Scores under 1 mean communities are more equal.
 View Larger +
Prev
Next
21.
North Smithfield
Percent earning under $14,999: 5.7%
Percent earning over $150,000: 15.3%
Median income: $77,378
% in Median bracket: 16.4%
Inequality Score: 1.28
Score Key: Figures above 1 correspond to more inequality. Scores under 1 mean communities are more equal.
 View Larger +
Prev
Next
20.
Cumberland
Percent earning under $14,999: 8.2%
Percent earning over $150,000: 14.5%
Median income: $72,160
% in Median bracket: 17.3%
Inequality Score: 1.31
Score Key: Figures above 1 correspond to more inequality. Scores under 1 mean communities are more equal.
 View Larger +
Prev
Next
19.
Scituate
Percent earning under $14,999: 5.7%
Percent earnng over $150,000: 16.7%
Median income: $78,980
% in Median bracket: 16.7%
Inequality Score: 1.34
Score Key: Figures above 1 correspond to more inequality. Scores under 1 mean communities are more equal.
 View Larger +
Prev
Next
18.
East Providence
Percent earning under $14,999: 13.2%
Percent earning over $150,000: 6.3%
Median income: $48,521
% in Median bracket: 14.2%
Inequality Score: 1.37
Score Key: Figures above 1 correspond to more inequality. Scores under 1 mean communities are more equal.
 View Larger +
Prev
Next
17.
Johnston
Percent earning under $14,999: 14.9%
Percent earning over $150,000: 8.6%
Median income: $56,343
% in Median bracket: 16.8%
Inequality Score: 1.40
Score Key: Figures above 1 correspond to more inequality. Scores under 1 mean communities are more equal.
 View Larger +
Prev
Next
16.
Newport
Percent earning under $14,999: 9.1%
Percent earning over $150,000: 15.2%
Median income: $71,713
% in Median bracket: 17.3%
Inequality Score: 1.40
Score Key: Figures above 1 correspond to more inequality. Scores under 1 mean communities are more equal.
 View Larger +
Prev
Next
15.
South Kingstown
Percent earning under $14,999: 5.8%
Percent earning over $150,000: 18.9%
Median income: $73,780
% in Median bracket: 17.4%
Inequaltiy Score: 1.42
Score Key: Figures above 1 correspond to more inequality. Scores under 1 mean communities are more equal.
 View Larger +
Prev
Next
14.
Barrington
Percent earning under $14,999: 2.7%
Percent earning over $150,000: 30.1%
Median income: $103,696
% in Median bracket: 21.8%
Inequality Score: 1.50
Score Key: Figures above 1 correspond to more inequality. Scores under 1 mean communities are more equal.
 View Larger +
Prev
Next
13.
Bristol
Percent earning under $14,999: 13.9%
Percent earning over $150,000: 11.9%
Median income: $62,358
% in Median bracket: 16.6%
Inequality Score: 1.55
Score Key: Figures above 1 correspond to more inequality. Scores under 1 mean communities are more equal.
 View Larger +
Prev
Next
12.
Narragansett
Percent earning under $14,999: 9.3%
Percent earning over $150,000: 17.2%
Median income: $66,600
% in Median bracket: 16.9%
Inequality Score: 1.57
Score Key: Figures above 1 correspond to more inequality. Scores under 1 mean communities are more equal.
 View Larger +
Prev
Next
11.
Exeter
Percent earning under $14,999: 6.8%
Percent earning over $150,000: 16.3%
Median income: $81,591
% in Median bracket: 14.6%
Inequality Score: 1.58
Score Key: Figures above 1 correspond to more inequality. Scores under 1 mean communities are more equal.
 View Larger +
Prev
Next
10.
Pawtucket
Percent earning under $14,999: 20.1%
Percent earning over $150,000: 3.7%
Median income: $40,379
% in Median bracket: 14.6%
Inequality Score: 1.63
Score Key: Figures above 1 correspond to more inequality. Scores under 1 mean communities are more equal.
 View Larger +
Prev
Next
9.
Lincoln
Percent earning under $14,999: 7.2%
Percent earning over $150,000: 18.1%
Median income: $72,434
% in Median bracket: 15.4%
Inequality Score: 1.64
Score Key: Figures above 1 correspond to more inequality. Scores under 1 mean communities are more equal.
 View Larger +
Prev
Next
8.
Portsmouth
Percent earning under $14,999: 8.6%
Percent earning over $150,000: 21.8%
Median income: $74,487
% in Median bracket: 17.9%
Inequality Score: 1.70
Score Key: Figures above 1 correspond to more inequality. Scores under 1 mean communities are more equal.
 View Larger +
Prev
Next
7.
Central Falls
Percent earning under $14,999: 23.2%
Percent earning over $150,000: 0.9%
Median income: $27,993
% in Median bracket: 13.7%
Inequality Score: 1.76
Score Key: Figures above 1 correspond to more inequality. Scores under 1 mean communities are more equal.
 View Larger +
Prev
Next
6.
North Kingstown
Percent earning under $14,999: 6.7%
Percent earning over $150,000: 20.2%
Median income: $80,530
% in Median bracket: 14.3%
Inequality Score: 1.88
Score Key: Figures above 1 correspond to more inequality. Scores under 1 mean communities are more equal.
 View Larger +
Prev
Next
5.
Woonsocket
Percent earning under $14,999: 23.6%
Percent earning over $150,000: 3.2%
Median income: $36,058
% in Median income: 13.2%
Inequality Score: 2.03
Score Key: Figures above 1 correspond to more inequality. Scores under 1 mean communities are more equal.
 View Larger +
Prev
Next
4.
Little Compton
Percent earning under $14,999: 7.2%
Percent earning over $150,000: 21.7%
Median income: $85,852
% in Median income: 13.0%
Inequality Score: 2.22
Score Key: Figures above 1 correspond to more inequality. Scores under 1 mean communities are more equal.
 View Larger +
Prev
Next
3.
Providence
Percent earning under $14,999: 24.6%
Percent earning over $150,000: 6.8%
Median income: $37,632
% in Median income: 12.7%
Inequality Score: 2.47
Score Key: Figures above 1 correspond to more inequality. Scores under 1 mean communities are more equal.
 View Larger +
Prev
Next
2.
Jamestown
Percent earning under $14,999: 8.6%
Percent earning over $150,000: 25.3%
Median income: $90,484
% in Median income: 13.2%
Inequality Score: 2.57
Score Key: Figures above 1 correspond to more inequality. Scores under 1 mean communities are more equal.
 View Larger +
Prev
Next
1.
East Greenwich
Percent earning under $14,999: 5.9%
Percent earning over $150,000: 33.1%
Median income: $96,438
% in Median income: 11.2%
Inequality Score: 3.48
Score Key: Figures above 1 correspond to more inequality. Scores under 1 mean communities are more equal.
Enjoy this post? Share it with others.


