John Perilli: I Wish Climate Change Were a Hoax, But It’s Not
Wednesday, March 12, 2014
John Perilli, GoLocalProv MINDSETTER™
 View Larger +
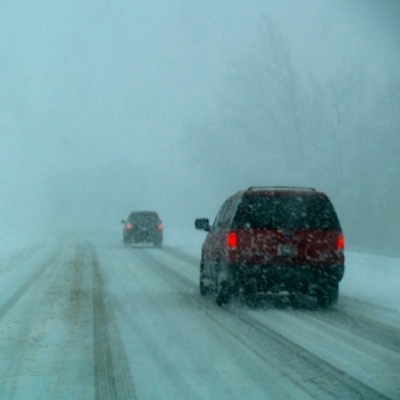
We need to accept that climate change is real so we can start to debate how to respond to it, believes John Perilli.
Even in the midst of an unseasonably cold March, it’s important to remember that climate change is still real.
I say this only because it has become fashionable to use this year’s wintry weather as an excuse to poke fun at one of the world’s most terrible scientific truths. The ever-wise Donald Trump took to Twitter earlier this year to mock the idea of climate change, and Texas Republican Sen. Ted Cruz, his fiery breath chilled by the frost, quipped: "It’s cold. Al Gore told me this wouldn’t happen.”
Laugh all you want, but the people saying these things are not without influence. They run some of the world’s largest businesses, control billions of dollars worth of natural resources, and hold the power to vote for or against a possible climate change solution. And worse, their dismissals of climate change as a “hoax” and a “conspiracy” have the chance to gain a deadly bit of traction.
GET THE LATEST BREAKING NEWS HERE -- SIGN UP FOR GOLOCAL FREE DAILY EBLAST
Look. No one would be happier than me if climate change were a hoax, or if a group of scientists emerged from behind the green screen, Wizard-of-Oz style, and said, “Gotcha! It’s all been a deception.” The world would be rid of one of its greatest problems, saving time, money and millions of lives.
But as Founding Father and President John Adams once said, “Facts are stubborn things; and whatever may be our wishes, our inclinations, or the dictates of our passion, they cannot alter the state of facts and evidence.” The fact of climate change is beyond the longest shadow of a doubt. The challenge, then, is not to prove climate change exists, but to change hearts and minds into accepting it, and to dismiss those last lingering counter-arguments so we can move onto the more important debate about what should be done.
Defining a Disaster
To start, I’ll define “climate change” the same way the United Nations does: as a measurable and significant change of climate that is attributable to human behavior. In other words: The world is rapidly warming, and it's most likely because of us. Global warming could pose all sorts of problems, from rising sea levels, to food shortages, to widespread population displacement. The scientific academies in every industrialized country of the world believe this is true. And there my case rests.
However, facts without action are dead on the page. The United States has taken many measures to combat climate change, but a lack of support has kept some truly effective solutions, like a carbon tax, off the table. Our House of Representatives is controlled by a Republican party whose official platform barely mentions climate change at all.
So how can this be bettered? How can one of America’s two major political parties be brought to the table to discuss difficult yet meaningful policy proposals?
Some are doing this just by talking. Rhode Island’s own Sen. Sheldon Whitehouse gives a speech on climate change before the Senate every week, and yesterday he participated in a massive all-night climate change “talkathon” to encourage Congress to act.
Others are taking direct legislative action. One group, the Rhode Island Student Climate Coalition, has been fighting to get the climate change issue on the General Assembly’s radar. Could a comprehensive environmental bill be Rhode Island’s ticket to national renown?
Whatever the method, it seems the effort to change Republicans’ minds might be working. GOP doubtfulness about the immediacy of climate change is cautiously receding. As the effects of climate change become more apparent, as massive out-of-season hurricanes and climbing average temperatures become harder to ignore, skepticism will hopefully decline even further.
Dismissing the Last Defense
Still, the “hoax” reaction remains an easy and tempting way out of a tough discussion. In the face of some of the frightening evidence for climate change, such as the infamous “hockey stick graph,” many doubtless find it less troubling to consider climate change a scam than to think about what the evidence implies. In fact, it’s a sign of just how alarming the evidence is that this reaction is so common.
I would like to respond to the hoax defense.
Some minds cannot be changed. I accept that. But to anyone who might doubt where they stand, consider this: Why would scientists want to perpetuate such an elaborate ruse? Why would all the world’s leading academics support using so much money and effort to combat climate change if it were not real? If climate change were a hoax, the billions of dollars spent fighting it could go toward research, or economic development, or ending poverty. For example, it would only take $17.5 billion, mere nickels compared to the cost of a global climate change initiative, to double the budget of NASA and send us off exploring the universe. Why wouldn’t scientists rather do that?
Again, I would love if climate change were a hoax. I would love if I could just wake up one day and not have to worry about a pressing global crisis that will happen within my lifetime. But I can’t. My generation and I have to own up to our peculiar burden, and answer one of the most important questions of our time: What should we do about it?
Creating Action from Inaction
Even if everyone accepted climate change as fact, the problem would not be over. There would still be an equally intense debate over how to counter it.
Some would support a more gradual response, such as infrastructure projects that could lessen the impact of rising seas and farming initiatives that could ease a catastrophic strike to our food supply. Others would insist upon all-or-nothing action. This debate would be angry, and it would be lengthy, and if no consensus emerged, we’d be just as doomed as we ever were.
However there is still some hope. The world has come together once before to deal successfully with a global environmental crisis. Back in the mid-twentieth century, pollutants called chlorofluorocarbons (CFCs) from aerosol cans and refrigerators were tearing a hole in our ozone layer. In response, the United Nations came together in 1987 and passed the Montreal Protocol, which phased out the legal use of these chemicals. In the years since, our ozone layer has made a remarkable recovery.
Climate change will be a much harder struggle. The costs will be higher, and the timeline for action longer. Can the whole world sit down at the bargaining table, dismiss the last “hoax” arguments, and get something done? Our limited time will tell.
John Perilli is a native of Cumberland, RI and a junior at Brown University. He is the Communications Director for the Brown University Democrats and works for Magaziner for Treasurer. The opinions presented in this article do not represent those of the organizations of which John Perilli is a member. You can follow John on Twitter @JohnPerilli.
Related Slideshow: Natural Disasters: RI’s Most At Risk and Vulnerable Communities
The below slides show what communities are at greatest risk and most vulnerable to a particular natural disaster, such as another hurricane, or a less-common disaster, such as an earthquake or a tornado. Higher scores correspond to a higher risk and vulnerability for that community. Cities and towns are listed starting with those that have the least risk and vulnerability, ending with the most at-risk and most vulnerable. Because flooding is a particular concern to Rhode Islanders, additional information on the threat of flooding from a major 100-year storm is shown.
Scoring method
The score for each type of hazard was determined by multiplying two separate scores together: the hazard risk score and the vulnerability score. The hazard risk score was calculated by multiplying three scores together: the score for frequency (how often something happens), the score for area impact (area that would be affected), and the score for intensity (such as the depth of a flood or the wind speed of a three-second gust in a hurricane). Higher scores mean a higher risk. The vulnerability score was derived using a similar multi-layered calculation that takes into account the population size and characteristics (for example, elderly and low-income populations are more vulnerable), the economy, the environment, and the number and importance of critical facilities like hospitals or power stations. Higher scores mean a greater vulnerability.
The scores are not against any scale. Instead they are relative in nature, showing how risk and vulnerability for a natural disaster is distributed throughout the state. A community with a higher score has a greater share of risk and vulnerability than one with a lower score. Scores and method information are from 2011 State Hazard Mitigation Plan. (A 2014 updated plan has been recently released, but numerical scores are not provided for each community.) For a detailed description of the entire scoring method, see PDF pages 123 to 145 on the 2011 plan.
 View Larger +
Prev
Next
#39 Little Compton
Natural Hazard Scores
Wind Score: 160
Flood Score: 18
Earthquake Score: 60
Tornado Score: 16
Snow Score: 50
Total Score: 424
Flood Damage
Rank: 14
Acres at Risk of Flooding: 2,516
Percent of Total Acres in Community at Risk: 16.78%
Hurricane Coastal Flooding
Number of Residents in Evac. Zone: 1,160
Number of Buildings at Risk: 187
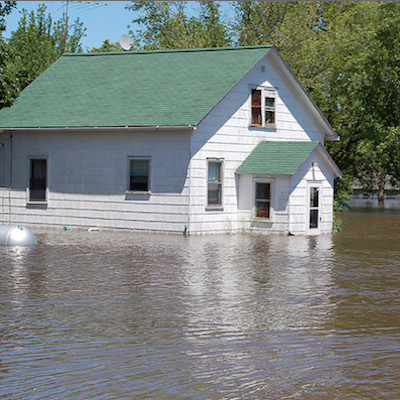
Photo: Flickr/Al Carmadella Jr.
 View Larger +
Prev
Next
#38 Richmond
Natural Hazard Scores
Wind Score: 200
Flood Score: 18
Earthquake Score: 90
Tornado Score: 24
Snow Score: 75
Total Score: 587
Flood Damage
Rank: 24
Acres at Risk of Flooding: 2,945
Percent of Total Acres in Community at Risk: 11.35%
Hurricane Coastal Flooding
Number of Residents in Evac. Zone: N/A
Number of Buildings at Risk: N/A
 View Larger +
Prev
Next
#37 Exeter
Natural Hazard Scores
Wind Score: 240
Flood Score: 0
Earthquake Score: 90
Tornado Score: 24
Snow Score: 75
Total Score: 609
Flood Damage
Rank: 36
Acres at Risk of Flooding: 2,190
Percent of Total Acres in Community at Risk: 5.78%
Hurricane Coastal Flooding
Number of Residents in Evac. Zone: N/A
Number of Buildings at Risk: N/A
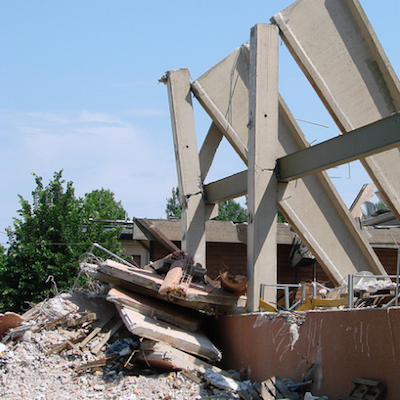
Photo: Flickr/UCL Mathematical
 View Larger +
Prev
Next
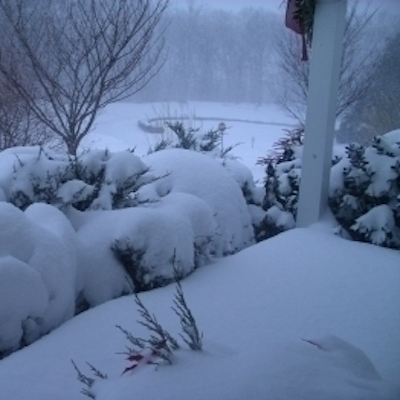
#36 West Greenwich
Natural Hazard Scores
Wind Score: 240
Flood Score: 0
Earthquake Score: 90
Tornado Score: 24
Snow Score: 75
Total Score: 609
Flood Damage
Rank: 39
Acres at Risk of Flooding: 1,197
Percent of Total Acres in Community at Risk: 3.62%
Hurricane Coastal Flooding
Number of Residents in Evac. Zone: N/A
Number of Buildings at Risk: N/A
Photo: Flickr/born1945
 View Larger +
Prev
Next
#35 New Shoreham
Natural Hazard Scores
Wind Score: 300
Flood Score: 27
Earthquake Score: 90
Tornado Score: 24
Snow Score: 75
Total Score: 696
Flood Damage
Rank: 13
Acres at Risk of Flooding: 1,220
Percent of Total Acres in Community at Risk: 17.3%
Hurricane Coastal Flooding
Number of Residents in Evac. Zone: 840
Number of Buildings at Risk: 20
Photo: Flickr/Al Camardella Jr.
.png) View Larger +
View Larger +
Prev
Next
#34 Foster
Natural Hazard Scores
Wind Score: 180
Flood Score: 18
Earthquake Score: 120
Tornado Score: 32
Snow Score: 200
Total Score: 790
Flood Damage
Rank: 28
Acres at Risk of Flooding: 2,659
Percent of Total Acres in Community at Risk: 7.94%
Hurricane Coastal Flooding
Number of Residents in Evac. Zone: N/A
Number of Buildings at Risk: N/A
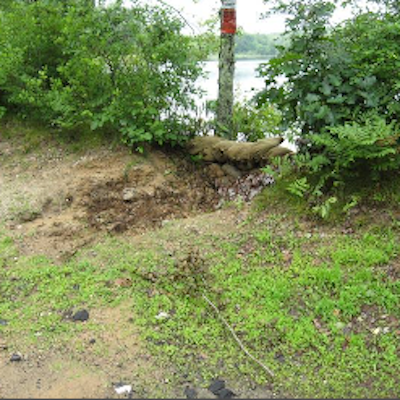
Photo: Flickr/US Geological Survey
 View Larger +
Prev
Next
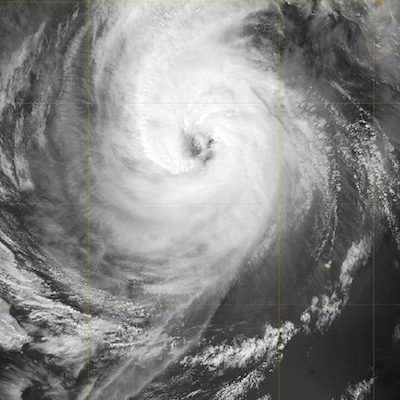
#33 Jamestown
Natural Hazard Scores
Wind Score: 480
Flood Score: 54
Earthquake Score: 180
Tornado Score: 48
Snow Score: 150
Total Score: 1,272
Flood Damage
Rank: 20
Acres at Risk of Flooding: 766
Percent of Total Acres in Community at Risk: 11.95%
Hurricane Coastal Flooding
Number of Residents in Evac. Zone: 3,910
Number of Buildings at Risk: 108
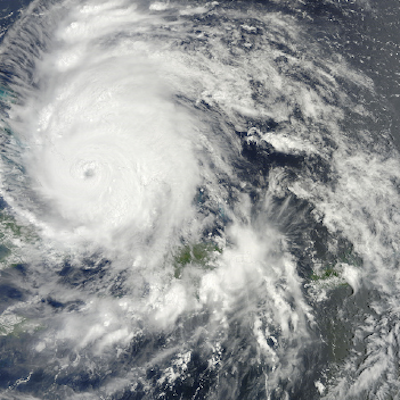
Photo: Flickr/NASA Goddard
 View Larger +
Prev
Next
#32 Hopkinton
Natural Hazard Scores
Wind Score: 600
Flood Score: 54
Earthquake Score: 210
Tornado Score: 56
Snow Score: 175
Total Score: 1,515
Flood Damage
Rank: 21
Acres at Risk of Flooding: 3,412
Percent of Total Acres in Community at Risk: 11.86%
Hurricane Coastal Flooding
Number of Residents in Evac. Zone: N/A
Number of Buildings at Risk: N/A
 View Larger +
Prev
Next
#31 North Smithfield
Natural Hazard Scores
Wind Score: 480
Flood Score: 27
Earthquake Score: 210
Tornado Score: 56
Snow Score: 350
Total Score: 1,543
Flood Damage
Rank: 26
Acres at Risk of Flooding: 1,727
Percent of Total Acres in Community at Risk: 10.63%
Hurricane Coastal Flooding
Number of Residents in Evac. Zone: N/A
Number of Buildings at Risk: N/A
Photo: Flickr/ilovemypit
.png) View Larger +
View Larger +
Prev
Next
#30 Charlestown
Natural Hazard Scores
Wind Score: 680
Flood Score: 144
Earthquake Score: 210
Tornado Score: 56
Snow Score: 175
Total Score: 1,685
Flood Damage
Rank: 4
Acres at Risk of Flooding: 9,276
Percent of Total Acres in Community at Risk: 34.08%
Hurricane Coastal Flooding
Number of Residents in Evac. Zone: 2,510
Number of Buildings at Risk: 838
.png) View Larger +
View Larger +
Prev
Next
#29 Glocester
Natural Hazard Scores
Wind Score: 500
Flood Score: 27
Earthquake Score: 240
Tornado Score: 64
Snow Score: 400
Total Score: 1,711
Flood Damage
Rank: 34
Acres at Risk of Flooding: 2,271
Percent of Total Acres in Community at Risk: 6.2%
Hurricane Coastal Flooding
Number of Residents in Evac. Zone: N/A
Number of Buildings at Risk: N/A
Photo: Flickr/Michael Dolan
 View Larger +
Prev
Next
#28 East Greenwich
Natural Hazard Scores
Wind Score: 720
Flood Score: 63
Earthquake Score: 270
Tornado Score: 72
Snow Score: 225
Total Score: 1,890
Flood Damage
Rank: 17
Acres at Risk of Flooding: 1,500
Percent of Total Acres in Community at Risk: 14.03%
Hurricane Coastal Flooding
Number of Residents in Evac. Zone: 1,240
Number of Buildings at Risk: N/A
Photo: Flickr/Sean Naber
 View Larger +
Prev
Next
#27 Scituate
Natural Hazard Scores
Wind Score: 500
Flood Score: 99
Earthquake Score: 270
Tornado Score: 72
Snow Score: 450
Total Score: 1,931
Flood Damage
Rank: 11
Acres at Risk of Flooding: 6,368
Percent of Total Acres in Community at Risk: 17.98%
Hurricane Coastal Flooding
Number of Residents in Evac. Zone: N/A
Number of Buildings at Risk: N/A
Photo: Flickr/US Geological Survey
 View Larger +
Prev
Next
#26 Middletown
Natural Hazard Scores
Wind Score: 800
Flood Score: 36
Earthquake Score: 300
Tornado Score: 80
Snow Score: 250
Total Score: 2,066
Flood Damage
Rank: 37
Acres at Risk of Flooding: 499
Percent of Total Acres in Community at Risk: 5.63%
Hurricane Coastal Flooding
Number of Residents in Evac. Zone: 2,012
Number of Buildings at Risk: N/A
Photo: Flickr/Ani Carrington
 View Larger +
Prev
Next
#25 Central Falls
Natural Hazard Scores
Wind Score: 740
Flood Score: 36
Earthquake Score: 300
Tornado Score: 80
Snow Score: 500
Total Score: 2,256
Flood Damage
Rank: 16
Acres at Risk of Flooding: 121
Percent of Total Acres in Community at Risk: 14.58%
Hurricane Coastal Flooding
Number of Residents in Evac. Zone: N/A
Number of Buildings at Risk: N/A
 View Larger +
Prev
Next
#24 Tiverton
Natural Hazard Scores
Wind Score: 880
Flood Score: 54
Earthquake Score: 330
Tornado Score: 88
Snow Score: 275
Total Score: 2,287
Flood Damage
Rank: 22
Acres at Risk of Flooding: 2,335
Percent of Total Acres in Community at Risk: 11.51%
Hurricane Coastal Flooding
Number of Residents in Evac. Zone: 3,080
Number of Buildings at Risk: 191
 View Larger +
Prev
Next
#23 Warren
Natural Hazard Scores
Wind Score: 800
Flood Score: 198
Earthquake Score: 330
Tornado Score: 88
Snow Score: 275
Total Score: 2,351
Flood Damage
Rank: 5
Acres at Risk of Flooding: 1,431
Percent of Total Acres in Community at Risk: 33.99%
Hurricane Coastal Flooding
Number of Residents in Evac. Zone: 7,520
Number of Buildings at Risk: 534
 View Larger +
Prev
Next
#22 Lincoln
Natural Hazard Scores
Wind Score: 740
Flood Score: 45
Earthquake Score: 360
Tornado Score: 96
Snow Score: 600
Total Score: 2,561
Flood Damage
Rank: 35
Acres at Risk of Flooding: 752
Percent of Total Acres in Community at Risk: 6.12%
Hurricane Coastal Flooding
Number of Residents in Evac. Zone: N/A
Number of Buildings at Risk: N/A
 View Larger +
Prev
Next
#21 Narragansett
Natural Hazard Scores
Wind Score: 1,180
Flood Score: 198
Earthquake Score: 390
Tornado Score: 104
Snow Score: 325
Total Score: 2,977
Flood Damage
Rank: 2
Acres at Risk of Flooding: 4,224
Percent of Total Acres in Community at Risk: 39.2
Hurricane Coastal Flooding
Number of Residents in Evac. Zone: 9,030
Number of Buildings at Risk: N/A
 View Larger +
Prev
Next
#20 Portsmouth
Natural Hazard Scores
Wind Score: 1,120
Flood Score: 216
Earthquake Score: 420
Tornado Score: 112
Snow Score: 350
Total Score: 3,058
Flood Damage
Rank: 7
Acres at Risk of Flooding: 4,238
Percent of Total Acres in Community at Risk: 26.64
Hurricane Coastal Flooding
Number of Residents in Evac. Zone: 6,530
Number of Buildings at Risk: 1,078
Photo: Flickr/Core Burn
 View Larger +
Prev
Next
#19 Smithfield
Natural Hazard Scores
Wind Score: 920
Flood Score: 72
Earthquake Score: 420
Tornado Score: 112
Snow Score: 700
Total Score: 3,094
Flood Damage
Rank: 30
Acres at Risk of Flooding: 1,201
Percent of Total Acres in Community at Risk: 6.74%
Hurricane Coastal Flooding
Number of Residents in Evac. Zone: N/A
Number of Buildings at Risk: N/A
View Larger +
Prev
Next
#18 Barrington
Natural Hazard Scores
Wind Score: 860
Flood Score: 243
Earthquake Score: 420
Tornado Score: 112
Snow Score: 600
Total Score: 3,066
Flood Damage
Rank: 1
Acres at Risk of Flooding: 2,417
Percent of Total Acres in Community at Risk: 40.97%
Hurricane Coastal Flooding
Number of Residents in Evac. Zone: 13,890
Number of Buildings at Risk: 784
 View Larger +
Prev
Next
#17 Bristol
Natural Hazard Scores
Wind Score: 1,200
Flood Score: 135
Earthquake Score: 480
Tornado Score: 128
Snow Score: 400
Total Score: 3,303
Flood Damage
Rank: 8
Acres at Risk of Flooding: 1,745
Percent of Total Acres in Community at Risk: 26.28
Hurricane Coastal Flooding
Number of Residents in Evac. Zone: 5,330
Number of Buildings at Risk: 483
 View Larger +
Prev
Next
#16 Coventry
Natural Hazard Scores
Wind Score: 1,160
Flood Score: 81
Earthquake Score: 480
Tornado Score: 128
Snow Score: 550
Total Score: 3,359
Flood Damage
Rank: 38
Acres at Risk of Flooding: 2,147
Percent of Total Acres in Community at Risk: 5.26%
Hurricane Coastal Flooding
Number of Residents in Evac. Zone: N/A
Number of Buildings at Risk: N/A
 View Larger +
Prev
Next
#15 Burrillville
Natural Hazard Scores
Wind Score: 906
Flood Score: 63
Earthquake Score: 510
Tornado Score: 136
Snow Score: 850
Total Score: 3,539
Flood Damage
Rank: 32
Acres at Risk of Flooding: 2,394
Percent of Total Acres in Community at Risk: 6.39
Hurricane Coastal Flooding
Number of Residents in Evac. Zone: N/A
Number of Buildings at Risk: N/A
 View Larger +
Prev
Next
#14 Johnston
Natural Hazard Scores
Wind Score: 1,180
Flood Score: 18
Earthquake Score: 510
Tornado Score: 136
Snow Score: 850
Total Score: 3,714
Flood Damage
Rank: 25
Acres at Risk of Flooding: 1,677
Percent of Total Acres in Community at Risk: 10.7%
Hurricane Coastal Flooding
Number of Residents in Evac. Zone: N/A
Number of Buildings at Risk: N/A
.png) View Larger +
View Larger +
Prev
Next
#13 South Kingstown
Natural Hazard Scores
Wind Score: 1,580
Flood Score: 171
Earthquake Score: 540
Tornado Score: 144
Snow Score: 450
Total Score: 3,965
Flood Damage
Rank: 6
Acres at Risk of Flooding: 12,168
Percent of Total Acres in Community at Risk: 29.51
Hurricane Coastal Flooding
Number of Residents in Evac. Zone: 7,310
Number of Buildings at Risk: 1,315
 View Larger +
Prev
Next
#12 Cumberland
Natural Hazard Scores
Wind Score: 1,180
Flood Score: 117
Earthquake Score: 600
Tornado Score: 160
Snow Score: 1,000
Total Score: 4,257
Flood Damage
Rank: 23
Acres at Risk of Flooding: 2,098
Percent of Total Acres in Community at Risk: 11.46%
Hurricane Coastal Flooding
Number of Residents in Evac. Zone: N/A
Number of Buildings at Risk: N/A
.png) View Larger +
View Larger +
Prev
Next
#11 Westerly
Natural Hazard Scores
Wind Score: 1,880
Flood Score: 189
Earthquake Score: 570
Tornado Score: 152
Snow Score: 475
Total Score: 4,406
Flood Damage
Rank: 9
Acres at Risk of Flooding: 5,604
Percent of Total Acres in Community at Risk: 26.15%
Hurricane Coastal Flooding
Number of Residents in Evac. Zone: 7,120
Number of Buildings at Risk: 1,342
 View Larger +
Prev
Next
#10 West Warwick
Natural Hazard Scores
Wind Score: 1,480
Flood Score: 99
Earthquake Score: 660
Tornado Score: 176
Snow Score: 925
Total Score: 4,660
Flood Damage
Rank: 19
Acres at Risk of Flooding: 629
Percent of Total Acres in Community at Risk: 12.21%
Hurricane Coastal Flooding
Number of Residents in Evac. Zone: N/A
Number of Buildings at Risk: N/A
 View Larger +
Prev
Next
#9 North Providence
Natural Hazard Scores
Wind Score: 1,400
Flood Score: 81
Earthquake Score: 690
Tornado Score: 184
Snow Score: 1,150
Total Score: 4,885
Flood Damage
Rank: 33
Acres at Risk of Flooding: 238
Percent of Total Acres in Community at Risk: 6.3%
Hurricane Coastal Flooding
Number of Residents in Evac. Zone: N/A
Number of Buildings at Risk: N/A
 View Larger +
Prev
Next
#8 North Kingstown
Natural Hazard Scores
Wind Score: 1,760
Flood Score: 297
Earthquake Score: 690
Tornado Score: 184
Snow Score: 575
Total Score: 4,886
Flood Damage
Rank: 10
Acres at Risk of Flooding: 5,538
Percent of Total Acres in Community at Risk: 19.12%
Hurricane Coastal Flooding
Number of Residents in Evac. Zone: 7,820
Number of Buildings at Risk: 850
Photo: Flickr/Jessica Merz
 View Larger +
Prev
Next
#7 Newport
Natural Hazard Scores
Wind Score: 1,880
Flood Score: 306
Earthquake Score: 720
Tornado Score: 192
Snow Score: 600
Total Score: 5,138
Flood Damage
Rank: 3
Acres at Risk of Flooding: 2,078
Percent of Total Acres in Community at Risk: 37.24%
Hurricane Coastal Flooding
Number of Residents in Evac. Zone: 10,590
Number of Buildings at Risk: 993
Photo: Flickr/ChalkyLives
 View Larger +
Prev
Next
#6 Woonsocket
Natural Hazard Scores
Wind Score: 2,260
Flood Score: 99
Earthquake Score: 1,110
Tornado Score: 296
Snow Score: 1,850
Total Score: 7,835
Flood Damage
Rank: 29
Acres at Risk of Flooding: 356
Percent of Total Acres in Community at Risk: 6.95%
Hurricane Coastal Flooding
Number of Residents in Evac. Zone: N/A
Number of Buildings at Risk: N/A
 View Larger +
Prev
Next
#5 East Providence
Natural Hazard Scores
Wind Score: 2,720
Flood Score: 225
Earthquake Score: 1,410
Tornado Score: 376
Snow Score: 2,350
Total Score: 9,901
Flood Damage
Rank: 12
Acres at Risk of Flooding: 1,610
Percent of Total Acres in Community at Risk: 17.37%
Hurricane Coastal Flooding
Number of Residents in Evac. Zone: 7,430
Number of Buildings at Risk: N/A
 View Larger +
Prev
Next
#4 Cranston
Natural Hazard Scores
Wind Score: 3,820
Flood Score: 360
Earthquake Score: 1,950
Tornado Score: 520
Snow Score: 3,250
Total Score: 13,800
Flood Damage
Rank: 27
Acres at Risk of Flooding: 1,541
Percent of Total Acres in Community at Risk: 8.25%
Hurricane Coastal Flooding
Number of Residents in Evac. Zone: 2,330
Number of Buildings at Risk: 640
.png) View Larger +
View Larger +
Prev
Next
#3 Pawtucket
Natural Hazard Scores
Wind Score: 4,880
Flood Score: 117
Earthquake Score: 2,160
Tornado Score: 576
Snow Score: 3,600
Total Score: 15,653
Flood Damage
Rank: 31
Acres at Risk of Flooding: 392
Percent of Total Acres in Community at Risk: 6.7%
Hurricane Coastal Flooding
Number of Residents in Evac. Zone: 1,150
Number of Buildings at Risk: N/A
 View Larger +
Prev
Next
#2 Warwick
Natural Hazard Scores
Wind Score: 5,400
Flood Score: 684
Earthquake Score: 2,400
Tornado Score: 640
Snow Score: 2,875
Total Score: 16,799
Flood Damage
Rank: 15
Acres at Risk of Flooding: 3,923
Percent of Total Acres in Community at Risk: 16.51%
Hurricane Coastal Flooding
Number of Residents in Evac. Zone: 28,760
Number of Buildings at Risk: 2,594
 View Larger +
Prev
Next
#1 Providence
Natural Hazard Scores
Wind Score: 10,980
Flood Score: 486
Earthquake Score: 5,850
Tornado Score: 1,560
Snow Score: 9,750
Total Score: 40,326
Flood Damage
Rank: 18
Acres at Risk of Flooding: 1,669
Percent of Total Acres in Community at Risk: 13.58%
Hurricane Coastal Flooding
Number of Residents in Evac. Zone: 1,010
Number of Buildings at Risk: 481
Related Articles
Enjoy this post? Share it with others.


.png)


.png)
.png)


.png)

.png)


.png)


_80_80_c1.png)


_80_80_c1.png)
_80_80_c1.png)


_80_80_c1.png)

_80_80_c1.png)


_80_80_c1.png)


