John Perilli: Don’t Just Delay NECAP Requirement—Get Rid Of It
Wednesday, May 14, 2014
The requirement that students have a certain proficiency on a NECAP test to graduate crushes economic opportunity, believes John Perilli
“NECAP is only one indicator of student performance and results of a single NECAP test administration should not be used for referring students to special education or for making promotion and/or graduation decisions.”
This is plain to read. The designers of the NECAP test strongly discouraged schools from using it as a graduation requirement, about as close to forbidding it as they could come. However, the Rhode Island Department of Education, in their haste to show our students just how important reading the instructions is, made attaining a certain level of proficiency on the NECAP a requirement to graduate high school.
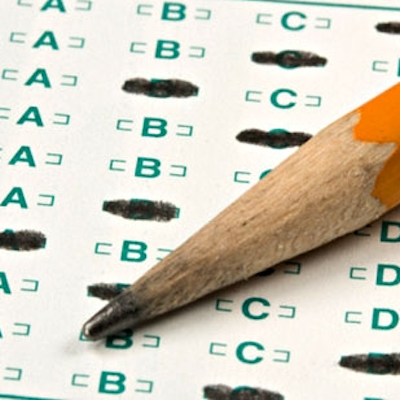
GET THE LATEST BREAKING NEWS HERE -- SIGN UP FOR GOLOCAL FREE DAILY EBLASTAs someone who could spell his name in test bubbles with his eyes closed, I was shocked by this. I’ve taken plenty of tests in my life, but I could never imagine the sheer pressure of having to pass one test or fail to graduate. Aside from this purely personal reaction, I found it abhorrent that a test designed to measure percentiles rather than proficiency was determining the fate of high school students. Thank goodness the Senate Education Committee delayed its implementation. But I’m calling on them to go further–– they should eliminate this opportunity-crushing requirement for good.
Degrees of Separation
There are many avenues through which I could find fault with the NECAP, but since so many have been pursued so much better than I ever could, I will focus on just one: the link between education and opportunity.
In the twenty-first century, post-Recession job market, a high school degree is difficult to be without. Currently, the unemployment rate of those without a high school diploma is a staggering twelve percent, nearly six points higher than the national average. Those who leave or are forced out of high school are greeted in the employed world with skepticism and economic hardship.
Well, you might say, what’s wrong with a GED? Nothing, strictly, but it isn’t the same as a high school diploma. Only one in ten GED recipients goes on to earn a college degree, and the labor market is much tougher on GED holders than diploma recipients.
Then you might ask a more basic question: why does the degree matter at all? It’s just a piece of paper, the saying goes. True, but economics is not sold on the fact that pure skill alone can earn one a living. There’s a theory in the economics of education called “signaling,” which means that employers hire well-educated workers because these workers have proven that they can withstand the busywork and hoop-jumping of going through school. If this theory is even partially true, high school dropouts are doomed.
Deficient at Proficiency
This is where the NECAP comes in. Aside from basic proficiency requirements, the NECAP stands as one of the strongest gates on the way to high school graduation in Rhode Island. The only problem is: The NECAP is not designed to measure proficiency.
This might strike you as odd. After all, don’t all tests measure proficiency to some degree? But rather than measure basic proficiency, the NECAP is designed to measure percentiles––essentially, to rank students, rather than test their ability. This leads to some amount of students, regardless of raw proficiency, being placed low on the curve. As engineer and policy analyst Tom Sgouros so artfully puts it, “the NECAP test is specifically designed to flunk a substantial proportion of students who take it.”
When a high school degree is so important to economic opportunity, how can we ever rebuild our state if we are actively blasting away our human capital? If we are taking one of our greatest economic assets in a post-industrial economy––our students––and intentionally setting some of them up to fail? This seems not only like a bad way to treat our students, but also like a lousy economic policy. In a way, the state is acting as a great sieve for the labor market: Here’s who is worth something in the economy, here’s who is not.
There are plenty of productive ways for Rhode Island to create economic growth, such as infrastructure investments and student loan credits, but gold-panning the labor market not one of them. There are enough reasons for low high-school graduation rates that we do not need to create another. Economic opportunity is not some ethereal phrase: It is the right to be tested on one’s merits, now how one stacks up on some arbitrary curve. The right to be given every chance to get educated and get ahead, not to be let down in the years when we can do the least about it.
A Test of Our Mettle
The NECAP, and other standardized tests in general, are more powerful than we realize. If we use them productively, to measure proficiency and improve student performance, they can be a great boon to our education system and our economy. But if we use them to take a set of students and tell them, under the pain and penalty of non-graduation purgatory, that you must pass this test, they can destroy lives, and while they’re at it, our economy. In some ways, these standardized tests are testing our public officials as well––will we use them responsibly, or not? I’m calling on the General Assembly to pass this test of character, and get rid of the NECAP requirement permanently.
As I said at the outset, I’m not one to draw wisdom from unconventional places simply for the sake of it. But on Twitter––that unlikeliest home of profundity––National Education Association of Rhode Island Executive Director Robert Walsh made the case best: “I oppose the death penalty because sometimes the wrong people die. I oppose high stakes testing because sometimes the wrong kids fail.”
John Perilli is a native of Cumberland, RI and a junior at Brown University. He is the Communications Director for the Brown University Democrats and works for Magaziner for Treasurer. The opinions presented in this article do not represent those of the organizations of which John Perilli is a member. You can follow John on Twitter @JohnPerilli.
Related Slideshow: 10 RI State Education Rankings
Related Articles
- John Perilli: Ghosts of Speakers Past
- John Perilli: RI’s Real Spending Problem: We Don’t Spend Enough
- John Perilli: How Can We Restore Confidence in the RI Government?
- John Perilli: Signing of People’s Pledge a Qualified Success
- John Perilli: Battle Heats Up to Succeed Fox in House District 4
- John Perilli: I Wish Climate Change Were a Hoax, But It’s Not
- John Perilli: Smith Hill’s Strongest Lobby, Unmasked
- John Perilli: Beware, the Marriage Equality Backlash Is Coming
- John Perilli: Keeping Outside Money Out of 2014 Election
- John Perilli: The Fallout of Political Retribution
- John Perilli: Bipartisanship Is Ugly
- John Perilli: Of Ducks, Debates and Dehumanization
- John Perilli: The Power of Data-Driven Politics
- John Perilli: Brain Drain Should Scare Us
- John Perilli: Pell’s Path Forward
- John Perilli: The Recovery Ain’t Over ‘Till It’s Over
- John Perilli: Don’t Axe the Lieutenant Governor
- John Perilli: Peter Neronha, US Attorney & Rising Political Star?
- John Perilli: Winning the War of Words
- John Perilli: Down With the Debt Ceiling
- John Perilli: RI Can Get an Easy Win if Senate Kills Master Lever


