
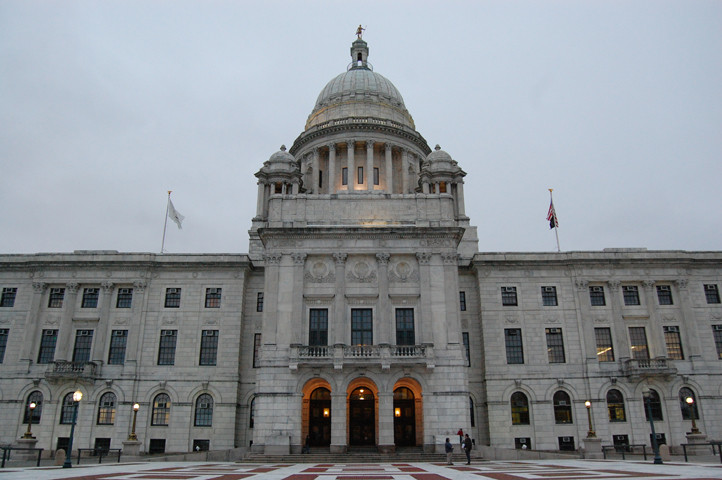
The 15 Most Expensive Government Programs in RI
Thursday, November 07, 2013
Rhode Island state and local governments spend more money on elementary and second education, public welfare, pensions, unemployment insurance, workers compensation, and disability insurance than all other public functions combined, new data shows.
Those findings are based on an annual report issued by the Rhode Island Public Expenditure Council, which uses the latest available U.S. Census data—in this case, fiscal year 2011—to assess how local and state government spend money.
The RIPEC report compares those figures to other states. But instead of looking only at per capita spending, the report also identifies how much is spent on each government function for every $1,000 earned in personal income. Measuring spending against income has the added advantage of giving some indicator of a state’s residents’ ability to pay for those services, according to RIPEC.
GET THE LATEST BREAKING NEWS HERE -- SIGN UP FOR GOLOCAL FREE DAILY EBLASTFor example, out of every $1,000 earned in the Rhode Island economy, $48.59 goes to elementary and secondary education—money normally collected through either property taxes at the local level or state income taxes that fund the Department of Education or are redirected to the local districts. That was the 15th highest rate of spending on elementary and secondary education in 2011. (See the below slides for a ranking of the top 15 spending areas.)
“It sounds like a reasonable approach and it might be the best you can do,” said University of Rhode Island economist Leonard Lardaro. The downside, Lardaro said, is that the data does not account for differences between state economies and where a particular state may be in its business cycle relative to another—a fact also acknowledged in the RIPEC report.
An argument for lower spending?
One local taxpayer advocate says the new numbers show the need to grow the state economy by reducing taxation.
“The RIPEC report should remind policymakers of an important link that we often lose sight of: that persistently high spending often correlates to lower levels of economic activity. And in practice, we indeed see this link in our state—some of the highest expenditure levels in the country coinciding with an incredibly dismal economic and business climate—which, as we sadly know, is resulting in fewer and fewer families and businesses calling Rhode Island home,” said Mike Stenhouse, CEO and President of the Rhode Island Center for Freedom and Prosperity.

The center is pushing for a repeal of the state sales tax, an idea currently being vetted through a state commission.
“The future of our residents can no longer be held hostage by a bloated, wasteful budget that has so obviously failed our state. To make this correlation work for us, instead of against us, and if spending cuts are required to support tax reductions that will boost the economy, then we must find a way to do just that,” Stenhouse said.
Viewed as a whole, state and local government spending puts Rhode Island in the middle of the pack. Rhode Island residents paid $253.03 out of every $1,000 they earned to support local and state government activities in fiscal year 2011. That rate ranks 23nd among the states, according to RIPEC.
RI spends more on fire protection than some Western states
“We’re not a high-spending state. We’re not a low-spending state,” said Gary Sasse, the former director of RIPEC and also the former director of administration under the Carcieri administration.
The issue isn’t the amount of spending, Sasse said, but where it goes. “Our priorities are out of whack,” he said.

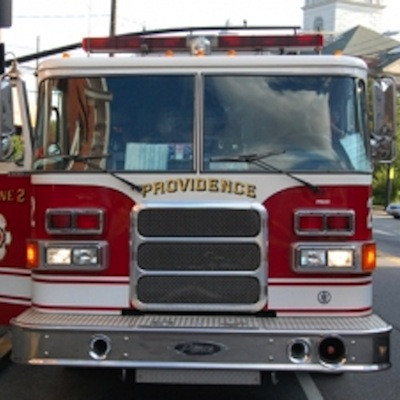
He noted that the state spends disproportionately more on fire protection and vendor payments to businesses—mostly for Medicaid—than other states. Rhode Islanders pay $6.50 out of every $1,000 earned for fire services, which is much less than other government functions in the state, but still enough to put in the state in second place nationally.
The top spender, in terms of cost per $1,000 in income, is Colorado, where a single wildfire this summer blazed through 16,000 acres, torched 486 buildings, and reportedly cost insurers $292.8 million.
In 2011, Colorado spent $9.78 out of every $1,000 earned on fire protection.
The third-ranking state is the largest one by land area, Alaska. At a comparable spending rate of $5.27 the state was able to battle 356 wildfires encompassing 145,839 acres in 2011, official state records show—and those figures include only those areas under state protection, not any managed by the U.S. Forest Service or other agencies.
The next two top-spenders on fire services are, like Colorado, Western states where drier conditions and extensive open spaces combine to make wildfires more of a problem: Arizona and Nevada. The closest New England state to Rhode Island is New Hampshire, where a spending rate of $3.27 put it 17th nationwide, RIPEC figures show.
Vendor payments in RI nearly doubled
Another driver of spending in Rhode Island, Sasse noted, is payments to vendors. Between 2000 and 2011, vendor payments as a share of $1,000 in personal income shot up from $24.43 to $46.16, a change in ranking from 13th to 5th highest in the country. Vendor payments rose at a rate faster than any other New England state. Most stem from state Medicaid expenses, according to RIPEC.
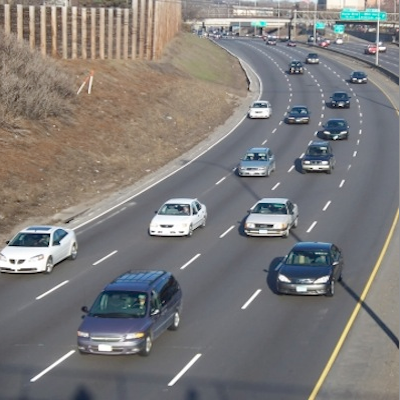
At the same time, Rhode Island is not focusing on areas that help the economy grow, such as transportation, other infrastructure, and higher education, Sasse noted. Rhode Island local and state governments combined fund highways at a rate of $7.66 per $1,000 in income, ranking 48th in the nation. Higher education spending has a comparable rate of $13.59, ranking 45th, according to RIPEC.

The lack of investment in higher education, Sasse said, is the biggest issue identified in the report.
That view appears to be one shared across the political spectrum. “We agree that areas like higher education highlight where we should be making deeper investments if we are to get our economy on track,” said Kate Brewster, executive director of the Economic Progress Institute.
Governor Lincoln Chafee has also made higher education spending a top priority since taking office in 2011. In his most recent budget proposal, Chafee proposed an increase of $6 million in state funding for its colleges and universities. That proposal was incorporated into the final version of the budget that passed out of the House Finance Committee. (Chafee’s office did not respond to a request for comment in time for publication; a spokesman for House Speaker Gordon Fox did not respond to a similar request for comment.)
Another problem area identified in the data is debt: interest on general debt was $12.13 out of $1,000 earned—the third highest nationwide.
After debt, the next most expensive area of spending is government administration, which costs $11.05 per $1,000, the 16th highest. Sasse said the state’s ranking raises questions about the efficiency of government in Rhode Island.
The report also suggests the pension liabilities are among the highest in the country. But those costs are grouped under the general heading of “insurance trust,” which also includes unemployment insurance, disability, and workers compensation. The $39.62 spent on “insurance trust” put Rhode Island at fourth in the nation, according to the report.

How much bang for the buck?
But many policy experts also pointed to a key deficiency in the findings: while the report thoroughly details spending rates and how they compare to other states, it does not provide a full accounting for what Rhode Island is getting in return for that spending, they said.
“Who cares how much we spend if you don’t also accompany it with analysis about what we get in exchange for that money? Or what the needs are?” said Tom Sgouros, a progressive blogger and policy expert. “RIPEC obviously spends a great deal of time and effort accumulating this data without apparently spending a dime to figure out what these numbers actually mean. The Census Bureau provides the numbers, so all they do is repackage them. Is that the most useful thing they can figure out to do?
For example, Sgouros noted that Rhode Island spending on health is behind 48 other states. “Is that because we don’t allocate enough for the job at hand, or because we spend very efficiently? The answer matters if you care about the health of our citizens,” he said. “Same with all the other services. If you care about outcomes, RIPEC’s is the beginning of the analysis, not the end.”

Lardaro agreed: “It’s really not an end point. It’s a starting point,” he said.
The real question, Lardaro said, is what benefit the state is getting from the spending identified in the RIPEC report. “But no one’s got the guts to look at the benefits,” he said.
Lardaro pointed to higher education as an example. Teacher salaries are among the highest in the nation while teacher-to-student ratios are on the lower end. Combined that should make for exceptional outcomes in education, he said. Instead, Rhode Island has been lagging in education performance—although that has started to turn around in recent years, Lardaro concluded. (GoLocalProv has previously reported on the disparity between education spending and performance. To read the report click here.)
Brewster pointed to other areas where the numbers presented don’t tell the whole story.
“For example, our 7th highest ranking in ‘public welfare’ masks the fact that spending on cash assistance, such as welfare benefits, ranks in the bottom third of states (37th), despite our continued high unemployment,” she said.
“The point is there is just a lot we’re doing wrong,” Lardaro said. “We’re doing this to ourselves. It’s not that hard to fix.”
Stephen Beale can be reached at [email protected]. Follow him on Twitter @bealenews
Related Slideshow: The 15 Costliest Government Programs in RI


#15 Non-Highway Transport
#14 Community Development
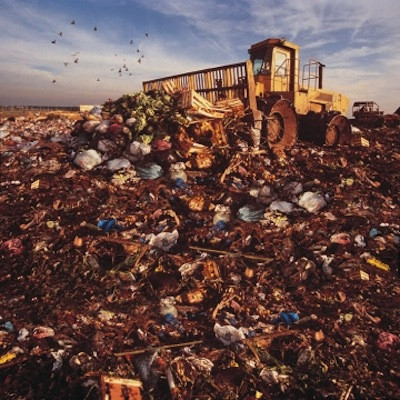
#13 Sewage & Solid Waste
#12 Health & Hospitals
#11 Other Ed. & Libraries
#10 Fire
#9 Highways
#8 Police
#7 Utilities
#6 Gov't. Administration
#5 Interest on Debt
#4 Higher Education
#3 Pensions and Other
#2 Public Welfare
#1 Elementary and Sec. Ed
Related Articles
- The Most Secretive Government Agencies in RI
- Lobbyist Spending Exploded in November
- Overspending or Underfunded? Providence School Budget in Crisis
- RI Blows $644 Million in ‘Wasteful’ Spending
- RI Second In Nation For Prison Inmate Spending
- REPORT: Rhode Island Government’s Transparency “Lagging”
- The Highest Taxed Communities for 2013
- Report Finds RI Government Workers Out-Earn Private Sector
- The Highest Taxed Fire Districts in RI
- Rhode Island’s Half a Billion Dollar Shadow Government
- New for 2012—The Highest Taxed Communities
