
The RI Communities with the Biggest Tax Increases
Thursday, January 09, 2014
The communities with the biggest increases in their tax levies include those who have struggled financially like Central Falls, Woonsocket, and West Warwick as well as others that haven’t, according to a new state report released this week.

For the first time since 2008, no community exceeded the tax cap, which was 4 percent this year. But those at the top came quite close. Central Falls was right on the line with an even 4 percent increase in the amount levied between fiscal years 2013 and 2014. Woonsocket, even accounting for its supplemental tax, stayed just under the cap, with a 3.99 percent increase.
But not every community that has had budget troubles had major increases. Providence was in the middle of the pack with a 2.42 percent rise in the $332.7 million in taxes it levied last year. East Providence raised its tax levy at an even lower rate, with a $1.9 million increase that represents a 1.91 percent change from last year.
GET THE LATEST BREAKING NEWS HERE -- SIGN UP FOR GOLOCAL FREE DAILY EBLASTStatewide, cities and towns are collecting $42.3 million more in taxes this year—a change of 1.87 percent over the previous fiscal year. Every single city and town increased their tax levy somewhat with the exception of two: Hopkinton and Pawtucket. Both communities actually decreased their tax levies by small percentages (Pawtucket had the greater decrease).
The smallest increase was in Cranston, which had a tax levy just .12 percent higher than last year.
Communities have consistently exceeded the cap—except this year
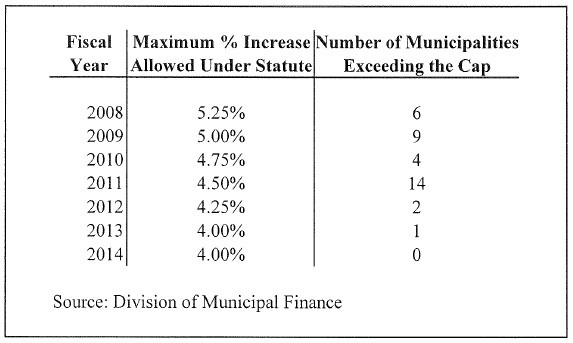
The property tax cap, which limits the overall increase in the amount levied, is locked in at 4 percent annually. Before 2007, the cap was 5.5 percent. Then, under a new state law, the cap was gradually decreased every year until it leveled off at 4 percent in 2013. However, state law has given communities leeway to exceed the cap, if it has a financial emergency, a substantial increase in debt payments, or a major expansion of its tax base.
Since the new tax cap system took effect, cities and towns have consistently applied for state approval to exceed the limit. Just one did last year, but half a dozen or more cities and towns have in previous years. The record was 14 in 2011, largely due to the decrease in state motor vehicle tax aid from a high of $136 million in fiscal year 2007 to just $10 million in 2011, according to Susanne Greschner, the chief of the state Division of Municipal Finance, which produced the report.
Roughly 30 communities at one time or another have broken the cap. But none did this year, according to Greschner.
With decreasing taxes, taxpayer advocates have higher expectations
While that may be good news for taxpayers, advocates say the tax climate—at least for property taxes—hasn’t improved much. “Certainly, Rhode Island's cities and towns should be applauded for not exceeding the tax cap in 2013. At the same time, while Rhode Island has had almost no population growth for over ten years, the state now has the fourth highest property taxes in the country,” said Monique Chartier, the spokeswoman for the Rhode Island Taxpayers.
“Perhaps, the larger question that arises from this report needs to be: when will local officials begin taking steps to lower property taxes? Kudos go in particular to Hopkinton and Pawtucket, who actually lowered their tax rates this year, though as GoLocalProv reported last year, Pawtucket is facing a pension system that is only 34 percent funded,” Chartier said in an e-mail. “But was this a one-off year for those two municipalities or will those rates continue to go down, as they should, year after year?”

Another taxpayer advocate, Lisa Blais, said the tax cap has not helped taxpayers as much as they expected. “Many taxpayers believed that the tax cap translated directly to their property tax bills; in other words, that their bills would not exceed the cap for that particular year,” said Blais, a spokeswoman for OSTPA. “Those homeowners and renters quickly learned that the tax cap was not meant to hold the line on their tax bill but was intended to limit the overall tax revenue haul for local municipalities.”
She pointed to the most recent property tax in Providence, which has had levy increases between 2.42 percent and 5.68 percent in recent years, while individual property tax bills have increased by as much as 25 percent to 27 percent.
Plus, the cap still grants communities exceptions for such things as increased health insurance costs, according to Blais.
“This particular example makes clear that the cost drivers in every public sector contract should be honestly and factually vetted for the purpose of improving cost containment. Property taxes are high on the list of regressive taxes. Rather than elected officials boasting surpluses (Cranston) or ‘near’ surpluses or ‘balanced checkbooks’ they should be aggressively working toward freezing and reversing the costs of unfunded local pensions, OPEB liabilities, and many other cost drivers in those contracts,” Blais said.
“Otherwise, we are left with the viscous cycle of increasing property taxes resulting in too many folks struggling to afford those taxes and too many renters collapsing under higher rents to cover the costs to own property,” Blais added. “For those cities, ignoring the economics and generating low increases doesn't necessarily mean that those cities are run more efficiently. Can anyone recall the last time that property tax bills trended downward and sustained that trend?”
Fiscally stressed communities top the list

It was little surprise that topping the list were Central Falls and Woonsocket—one went bankrupt and the other almost did. In Central Falls, the tax problem isn’t lost on newly minted Mayor James Diossa, who was first elected in December 2012 and marked his inauguration to his first multi-year term on Monday.
“When I became your Mayor last year, this was a city engulfed in a painful and costly bankruptcy process with no end in sight. Today, Central Falls has emerged from that process stronger and more vibrant than ever, and we are busy building a brighter, sustainable future for all our residents while ensuring that our city’s future is secure,” Diossa said in his inaugural remarks.
He said he is focusing on expanding the tax base. “I know that our city’s future depends on expanding our tax base and creating jobs. And that means helping our existing businesses grow while encouraging new businesses to open in our city,” Diossa said. Three new developments are already underway in the city. On Monday, Diossa announced two more companies were locating to Central Falls, bringing with them 60 jobs.
In Woonsocket, new Mayor Lisa Baldelli-Hunt’s power over city finances is limited. A state-mandated budget commission is now in control of taxes and spending—the 3.99 percent tax increase a result of its decisions. As the mayor, Baldelli-Hunt does have seat on the commission, along with four other members, three of whom are appointed by the state Department of Revenue. (Baldelli-Hunt did not respond to a request for comment yesterday. Neither did Diossa.)
Exceptions to the rule
But along with Central Falls and Woonsocket, large tax increases were also seen in communities like East Greenwich and Burrillville.
Both communities have special circumstances that make their tax increases appear larger than they really are. In East Greenwich, the amount levied in taxes for fiscal years 2013 and 2014 reflects the merger between the municipal government and the once-independent first district, according to Greschner. That occurred in June 2013. (Independent fire districts are not included in municipal levies.)
Burrillville’s increase also is the result of unusual circumstances, according to Town Manager Michael Wood. This year, the levy is increasing by 3.63 percent—the seventh highest in the state. That’s still better than two years ago, when the levy shot up by 13.33 percent.

But those increases are not the result of budget issues. “It really isn’t a function of spending increases,” Wood said. “It’s an accounting and a legal issue.”
The issue, Wood said, is a shift in how Burrillville collects revenue from one of its biggest payers: the TransCanada power plant. Before he arrived in town, 17 years ago, it struck two payment-in-lieu-of-taxes agreements with the plant. When those expired a few years ago, the town started collecting regular taxes from the plant—and that money was added to the official tax levy, according to Wood.
How Pawtucket did it
Perhaps the biggest surprise in the report is Pawtucket, which, despite its own share of well-known fiscal troubles, was able to deliver a reduction in its tax levy. The amount levied in taxes went from a nearly even $100 million last year to $99.3 million, a decrease of -.68 percent, state records show.
When asked how the city pulled this off, Mayor Don Grebien responded: “One overall factor was simply doing more with less, including curbing unnecessary spending wherever possible, a management practice my administration has been committed to since assuming office three years ago.”
For the current fiscal year, Grebien said the city had a balanced budget “despite a zero increase in all property categories.” The budget still increased by $1.4 million, or 1.28 percent, to $110.7 million, according to Grebien.
“A key revenue factor for this fiscal year was securing a federal SAFER grant to hire 21 additional firefighters (salaries and benefits), added staffing which saved the city approximately $1 million it did not have to budget for overtime vs. the prior year. Another boost was a $1.1 million increase in state aid, and we also had revenue increases in some local categories,” Grebien said.

Another cost-cutting measure: outsourcing trash and recycling collection, which allowed the city “to avoid having to budget for major expenses” like replacing aging trucks—all without any layoffs, according to Grebien. In addition to budget cutting, he said the city has been able to rebuild its once “badly depleted ‘rainy day fund’” to $5.7 million.
“In the end, it comes down to good fiscal discipline by the city and a lot of work by a lot of hard-working city employees for the benefit of our residents and taxpayers,” Grebien said.
Chartier hopes that other communities follow suit. “Property taxes add to everyone’s cost of living, both tenants and property owners, in a state with an already high cost-of-living, not to mention creating an additional burden for our business community. Municipalities cannot be content with simply staying under the tax cap. They must undertake the difficult but vital task of backing Rhode Island down from its very high property tax ranking,” she said.
Stephen Beale can be reached at [email protected]. Follow him on Twitter @bealenews
Related Slideshow: Smallest + Largest Tax Increases in RI
Below are the largest—and smallest—tax increases in Rhode Island cities and towns for fiscal year 2014. The data measures the overall change in the amount levied in taxes between last year and this year. It does not compare changes in individual tax rates for homeowners, which may have been higher than the overall increase if the change in the rates was lower for another group of taxpayers in the community. This year, for the first time, all communities stayed below the annual tax cap, which for 2014 was 4 percent. (The cap applies to the overall levy not individual tax rates. Note that the levies for any independent fire districts in a community are not included.) Below communities are ranked starting with those that had the lowest increases. Data was provided by the state Division of Municipal Finance and is current as of January 7.


Related Articles
- New for 2012—The Highest Taxed Communities
- The Highest Taxed Fire Districts in RI
- The Highest Taxed Communities for 2014
- The Highest Taxed Communities for 2013
- See the List - The Highest Taxed Communities in RI
