slides: See the Communities with the Biggest Wealth Gaps
Thursday, April 23, 2015
GoLocalProv News Team
See the communities that have the greatest economic inequalities.
Related Slideshow: The Wealth Gap in RI Cities and Towns
The below slides list the most financially unequal cities and towns in Rhode Island, in order of least to most unequal. For each community, the percent of residents at the very bottom and the very top of the income scale are listed. In addition, the median income, which is the amount made by those in the middle, and the percent of those at the median are also provided for each community. The degree of inequality is measured by comparing the combined percent of those at the top and bottom with the percent of those in the middle. If the total percent of those at the top and bottom exceeds that for the middle, the community is has greater financial inequality than the one where most income earners are in the middle. Scores above 1 indicate greater financial inequality. Scores below 1 indicate less.
 View Larger +
Prev
Next
39.
Hopkinton
Percent earning under $14,999: 5.0%
Percent earning over $150,000: 9.4%
Median income: $67,022
% in Median bracket: 23.6%
Inequality Score: 0.00
Score Key: Figures above 1 correspond to more inequality. Scores under 1 mean communities are more equal.
 View Larger +
Prev
Next
38.
Charlestown
Percent earning under $14,999: 6.0%
Percent earning over $150,000: 9.8%
Median income: $69,349
% in Median bracket:19.5%
Inequality Score: 0.81
Score Key: Figures above 1 correspond to more inequality. Scores under 1 mean communities are more equal.
 View Larger +
Prev
Next
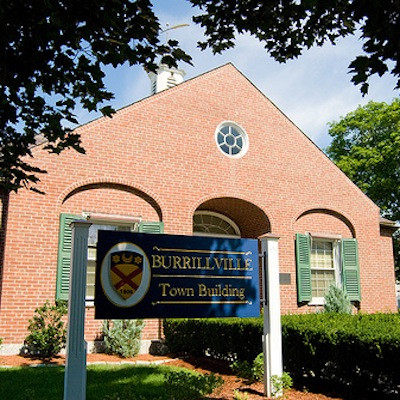
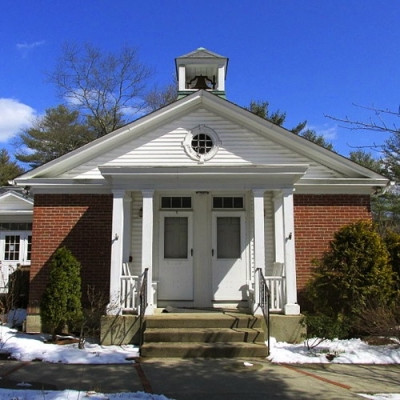
37.
Burrillville
Percent earning under $14,999: 8.1%
Percent earning over $150,000: 9.6%
Median income: $62,188
% in Median bracket: 20.7%
Inequality Score: 0.86
Score Key: Figures above 1 correspond to more inequality. Scores under 1 mean communities are more equal.
 View Larger +
Prev
Next
36.
Warwick
Percent earning under $14,999: 9.5%
Percent earning over $150,000: 9.1%
Median income: $62,295
% in Median bracket: 21.2%
Inequality Score: 0.88
Score Key: Figures above 1 correspond to more inequality. Scores under 1 mean communities are more equal.
 View Larger +
Prev
Next
35.
Coventry
Percent earning under $14,999: 9.0%
Percent earning over: $150,000: 9.2%
Median income: $65,565
% in Median bracket: 20.1%
Inequality Score: 0.91
Score Key: Figures above 1 correspond to more inequality. Scores under 1 mean communities are more equal.
 View Larger +
Prev
Next
34.
Foster
Percent earning under $14,999: 4.2%
Percent earning over $150,000:17.4%
Median income: $81,651
% in Median bracket: 23.5%
Inequality Score: 0.92
Score Key: Figures above 1 correspond to more inequality. Scores under 1 mean communities are more equal.
 View Larger +
Prev
Next
33.
Glocester
Percent earning under $14,999: 4.8%
Percent earning over $150,000: 11.6%
Median income: $80,942
% in Median bracket: 17.7%
Inequality Score: 0.93
Score Key: Figures above 1 correspond to more inequality. Scores under 1 mean communities are more equal.
 View Larger +
Prev
Next
32.
North Providence
Percent earning under $14,999: 13.1%
Percent earning over $150,000: 5.8%
Median income: $51,470
% in Median bracket: 19.6%
Inequality Score: 0.96
Score Key: Figures above 1 correspond to more inequality. Scores under 1 mean communities are more equal.
 View Larger +
Prev
Next
31.
Westerly
Percent earning under $14,999: 7.9%
Percent earning over $150,000: 11.5%
Median income: $60,532
% in Median bracket:18.5%
Inequality Score: 1.05
Score Key: Figures above 1 correspond to more inequality. Scores under 1 mean communities are more equal.
 View Larger +
Prev
Next
30.
New Shoreham
Percent earning under $14,999: 3.8 %
Percent earning over $150,000: 20.7%
Median income: $90,491
% in Median bracket: 23.0%
Inequality Score: 1.07
Score Key: Figures above 1 correspond to more inequality. Scores under 1 mean communities are more equal.
 View Larger +
Prev
Next
29.
Warren
Percent earning under $14,999: 11.3%
Percent earning over $150,000: 9.3%
Median income: $54,295
% in Median bracket: 18.8%
Inequality Score: 1.10
Score Key: Figures above 1 correspond to more inequality. Scores under 1 mean communities are more equal.
 View Larger +
Prev
Next
28.
Smithfield
Percent earning under $14,999: 5.2%
Percent earnng over $150,000: 16.0%
Median income: $74,000
% in Median bracket: 19.3%
Inequality Score: 1.10
Score Key: Figures above 1 correspond to more inequality. Scores under 1 mean communities are more equal.
 View Larger +
Prev
Next
27.
West Greenwich
Percent earning under $14,999: 2.9%
Percent earning over $150,000: 17.1%
Median income: $78,438
% in Median bracket: 18.1%
Inequality Score: 1.10
Score Key: Figures above 1 correspond to more inequality. Scores under 1 mean communities are more equal.
 View Larger +
Prev
Next
26.
Richmond
Percent earning under $14,999: 4.5%
Percent earning over $150,000: 20.2%
Median income: $93,975
% in Median bracket: 22.2%
Inequality Score: 1.11
Score Key: Figures above 1 correspond to more inequality. Scores under 1 mean communities are more equal.
 View Larger +
Prev
Next
25.
West Warwick
Percent earning under $14,999: 14.5%
Percent earning over $150,000: 4.4%
Median income: $50,590
% in Median bracket: 16.4%
Inequality Score: 1.15
Score Key: Figures above 1 correspond to more inequality. Scores under 1 mean communities are more equal.
 View Larger +
Prev
Next
24.
Middletown
Percent earning under $14,999: 9.2%
Percent earning over $150,000: 13.8%
Median income: $69,784
% in Median bracket: 19.3%
Inequality Score: 1.19
Score Key: Figures above 1 correspond to more inequality. Scores under 1 mean communities are more equal.
 View Larger +
Prev
Next
23.
Cranston
Percent earning under $14,999: 10.8%
Percent earning over $150,000: 9.6%
Median income: $60,283
% in Median bracket: 17.1%
Inequality Score: 1.19
Score Key: Figures above 1 correspond to more inequality. Scores under 1 mean communities are more equal.
 View Larger +
Prev
Next
22.
Tiverton
Percent earning under $14,999: 7.7%
Percent earning over $150,000: 11.6%
Median income: $73,085
% in Median bracket: 15.6%
Inequality Score: 1.24
Score Key: Figures above 1 correspond to more inequality. Scores under 1 mean communities are more equal.
 View Larger +
Prev
Next
21.
North Smithfield
Percent earning under $14,999: 5.7%
Percent earning over $150,000: 15.3%
Median income: $77,378
% in Median bracket: 16.4%
Inequality Score: 1.28
Score Key: Figures above 1 correspond to more inequality. Scores under 1 mean communities are more equal.
 View Larger +
Prev
Next
20.
Cumberland
Percent earning under $14,999: 8.2%
Percent earning over $150,000: 14.5%
Median income: $72,160
% in Median bracket: 17.3%
Inequality Score: 1.31
Score Key: Figures above 1 correspond to more inequality. Scores under 1 mean communities are more equal.
 View Larger +
Prev
Next
19.
Scituate
Percent earning under $14,999: 5.7%
Percent earnng over $150,000: 16.7%
Median income: $78,980
% in Median bracket: 16.7%
Inequality Score: 1.34
Score Key: Figures above 1 correspond to more inequality. Scores under 1 mean communities are more equal.
 View Larger +
Prev
Next
18.
East Providence
Percent earning under $14,999: 13.2%
Percent earning over $150,000: 6.3%
Median income: $48,521
% in Median bracket: 14.2%
Inequality Score: 1.37
Score Key: Figures above 1 correspond to more inequality. Scores under 1 mean communities are more equal.
 View Larger +
Prev
Next
17.
Johnston
Percent earning under $14,999: 14.9%
Percent earning over $150,000: 8.6%
Median income: $56,343
% in Median bracket: 16.8%
Inequality Score: 1.40
Score Key: Figures above 1 correspond to more inequality. Scores under 1 mean communities are more equal.
 View Larger +
Prev
Next
16.
Newport
Percent earning under $14,999: 9.1%
Percent earning over $150,000: 15.2%
Median income: $71,713
% in Median bracket: 17.3%
Inequality Score: 1.40
Score Key: Figures above 1 correspond to more inequality. Scores under 1 mean communities are more equal.
 View Larger +
Prev
Next
15.
South Kingstown
Percent earning under $14,999: 5.8%
Percent earning over $150,000: 18.9%
Median income: $73,780
% in Median bracket: 17.4%
Inequaltiy Score: 1.42
Score Key: Figures above 1 correspond to more inequality. Scores under 1 mean communities are more equal.
 View Larger +
Prev
Next
14.
Barrington
Percent earning under $14,999: 2.7%
Percent earning over $150,000: 30.1%
Median income: $103,696
% in Median bracket: 21.8%
Inequality Score: 1.50
Score Key: Figures above 1 correspond to more inequality. Scores under 1 mean communities are more equal.
 View Larger +
Prev
Next
13.
Bristol
Percent earning under $14,999: 13.9%
Percent earning over $150,000: 11.9%
Median income: $62,358
% in Median bracket: 16.6%
Inequality Score: 1.55
Score Key: Figures above 1 correspond to more inequality. Scores under 1 mean communities are more equal.
 View Larger +
Prev
Next
12.
Narragansett
Percent earning under $14,999: 9.3%
Percent earning over $150,000: 17.2%
Median income: $66,600
% in Median bracket: 16.9%
Inequality Score: 1.57
Score Key: Figures above 1 correspond to more inequality. Scores under 1 mean communities are more equal.
 View Larger +
Prev
Next
11.
Exeter
Percent earning under $14,999: 6.8%
Percent earning over $150,000: 16.3%
Median income: $81,591
% in Median bracket: 14.6%
Inequality Score: 1.58
Score Key: Figures above 1 correspond to more inequality. Scores under 1 mean communities are more equal.
 View Larger +
Prev
Next
10.
Pawtucket
Percent earning under $14,999: 20.1%
Percent earning over $150,000: 3.7%
Median income: $40,379
% in Median bracket: 14.6%
Inequality Score: 1.63
Score Key: Figures above 1 correspond to more inequality. Scores under 1 mean communities are more equal.
 View Larger +
Prev
Next
9.
Lincoln
Percent earning under $14,999: 7.2%
Percent earning over $150,000: 18.1%
Median income: $72,434
% in Median bracket: 15.4%
Inequality Score: 1.64
Score Key: Figures above 1 correspond to more inequality. Scores under 1 mean communities are more equal.
 View Larger +
Prev
Next
8.
Portsmouth
Percent earning under $14,999: 8.6%
Percent earning over $150,000: 21.8%
Median income: $74,487
% in Median bracket: 17.9%
Inequality Score: 1.70
Score Key: Figures above 1 correspond to more inequality. Scores under 1 mean communities are more equal.
 View Larger +
Prev
Next
7.
Central Falls
Percent earning under $14,999: 23.2%
Percent earning over $150,000: 0.9%
Median income: $27,993
% in Median bracket: 13.7%
Inequality Score: 1.76
Score Key: Figures above 1 correspond to more inequality. Scores under 1 mean communities are more equal.
 View Larger +
Prev
Next
6.
North Kingstown
Percent earning under $14,999: 6.7%
Percent earning over $150,000: 20.2%
Median income: $80,530
% in Median bracket: 14.3%
Inequality Score: 1.88
Score Key: Figures above 1 correspond to more inequality. Scores under 1 mean communities are more equal.
 View Larger +
Prev
Next
5.
Woonsocket
Percent earning under $14,999: 23.6%
Percent earning over $150,000: 3.2%
Median income: $36,058
% in Median income: 13.2%
Inequality Score: 2.03
Score Key: Figures above 1 correspond to more inequality. Scores under 1 mean communities are more equal.
 View Larger +
Prev
Next
4.
Little Compton
Percent earning under $14,999: 7.2%
Percent earning over $150,000: 21.7%
Median income: $85,852
% in Median income: 13.0%
Inequality Score: 2.22
Score Key: Figures above 1 correspond to more inequality. Scores under 1 mean communities are more equal.
 View Larger +
Prev
Next
3.
Providence
Percent earning under $14,999: 24.6%
Percent earning over $150,000: 6.8%
Median income: $37,632
% in Median income: 12.7%
Inequality Score: 2.47
Score Key: Figures above 1 correspond to more inequality. Scores under 1 mean communities are more equal.
 View Larger +
Prev
Next
2.
Jamestown
Percent earning under $14,999: 8.6%
Percent earning over $150,000: 25.3%
Median income: $90,484
% in Median income: 13.2%
Inequality Score: 2.57
Score Key: Figures above 1 correspond to more inequality. Scores under 1 mean communities are more equal.
 View Larger +
Prev
Next
1.
East Greenwich
Percent earning under $14,999: 5.9%
Percent earning over $150,000: 33.1%
Median income: $96,438
% in Median income: 11.2%
Inequality Score: 3.48
Score Key: Figures above 1 correspond to more inequality. Scores under 1 mean communities are more equal.
Related Articles
Enjoy this post? Share it with others.


