RI School Districts Lose Millions to Charter Schools
Thursday, June 18, 2015
School districts are losing millions in much-needed funds in inflated tuition payments to charter schools, according to a GoLocalProv analysis of data contained in a report from a legislative panel on the education funding formula.
Under the new formula, which was adopted in 2010, the cost of educating a child should follow him or her to a charter school, leaving no impact on districts. “What does not follow is all the expenses associated with the school district,” said state Rep. Jeremiah O’Grady, a Lincoln Democrat who chaired the panel.
Flawed assumption in funding formula
GET THE LATEST BREAKING NEWS HERE -- SIGN UP FOR GOLOCAL FREE DAILY EBLASTFrank Flynn, the president of the Rhode Island Federation of Teachers and Health Professionals and a panel member, offers the example of a classroom where just one or two students might leave. The money follows those one or two students to the charter school they have chosen, but the district still has to pay the full salaries and benefits of the teacher for that classroom—now without the money that went to the charters for those two students.
There are also other costs that are mandated for districts but not charters, such as the transition programs for special education students aged 18 to 21, pension payments, and early childhood programs, according to Flynn.
“So there is definitely a discrepancy in the … funding formula that we believe needs to be addressed,” Flynn said.
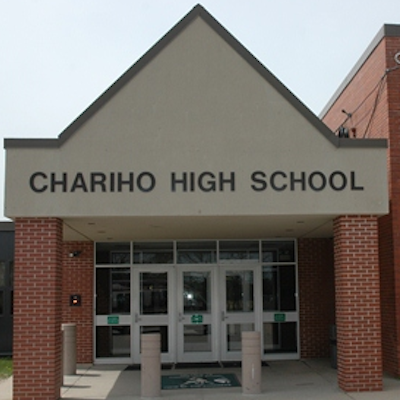
Many school districts say they are losing money to charter schools because of such fixed costs that do not “follow” the child to the charter school. Seven districts provided data to the panel showing a total of $5.4 million lost in the last school year. (Those districts are: Burrillville, Chariho, Cumberland, Exeter-West Greenwich, Lincoln, North Kingstown, and South Kingstown.)
The districts listed are those that were most affected, according to Tim Ryan, the executive director of the Rhode Island School Superintendents Association, which backs the findings of the report.
In fact, a GoLocalProv analysis for all school districts suggests that the total may be at least three times that. (See below slides.)
Cumberland official: school districts being defunded
And those costs are rising fast, according to Phil Thornton, the schools superintendent in Cumberland.
In 2008, the charter school tuition bill from charter schools to Cumberland was $125,000. In 2015 it is an estimated $3.2 million. In 24 months it will hit $4 million, according to Thornton. “We have increased costs each year and largely have the same student population,” Thornton said.
The disparity becomes apparent when viewed in terms of state aid.
“Cumberland’s state aid for next year will increase by $952,596. Of that amount, Cumberland will pay out an additional $832,147 to charter schools—for approximately 445 students. The 4,600 Cumberland School District students will receive just $120,000 in state aid. So each charter school student will receive $1,869 in new state aid and each Cumberland School District student will see $26,” Thornton said.
“If we want choice in RI, we need to fund choice. Our current system is simply defunding existing school districts for the creation of new charter districts,” Thornton said.
Providence could lose millions
Some districts are only beginning to feel the impact. In Providence, the opening of Achievement First was expected to cost the district $1.8 million in the current fiscal year, according to a December 2011 forecast prepared by Internal Auditor Matt Clarkin.
By 2018, Providence is projected to be losing as much as $9.2 million in funding to Achievement First, according to Clarkin’s analysis.
One glaring disparity is in special education.
Under the current education funding formula, expenditures are divided by the number of students to get a per-pupil figure. That figure is the tuition amount paid out to any charter schools that students who reside within the district are attending. But school districts have special education mandates that charters do not. They also have a higher percentage of special education students—and those students tend to have more severe disabilities than students with learning disabilities at charters, according to Flynn.
As a result, the special education share of per pupil expenditures is higher in school districts than it is for charters.
For example, the average per-pupil cost of special education for school districts is $3,653. The average per-pupil cost of special education for charters is $1,332. Of the charter schools, the one with the highest per-pupil cost of special education is the Blackstone Academy Charter School, where the figure is $2,215, which is still lower than the per-pupil figures in all but two of the school districts (Foster-Glocester and Scituate).
Despite such disparities, the higher cost of special education is included in the tuition districts pay out to charters. For example, Providence is paying tuition to charter schools as if their per-pupil cost of special education was the same as Providence’s—which is $3,625—when, in fact, their cost is lower. That means that Providence is overpaying charter schools to the tune of $6.8 million, according to a GoLocalProv comparison of Providence’s special education costs with those of the charters to which it is sending students.
RIDE ultimately backs report
The findings of the report have met with some resistance and skepticism from charter school advocates.
One of the earliest voices came from with the Rhode Island Department of Education (RIDE). A top department official penned a May 13 letter to the Statehouse commission saying the report had “failed to systematically use verifiable data and sound methods of analysis.” In addition, the data used in the report was “incomplete, inaccurate, lacked requisite levels of validation, or was produced through unclear methods,” according to the official, Andrea Castaneda, the chief of the Division of Fiscal Integrity and Statewide Efficiencies.
When questioned about the data, Ryan defended it, noting that the numbers districts provided are the only ones available and that those districts are also the source of data used by RIDE itself. O’Grady said that school district officials also stood by the figures they had provided to the commission, which he described as “evidence.”
Castaneda also accused the report’s authors of being biased. “[T]he Study Commission deliberations appeared biased, and these deliberations frequently framed issues so as to favor the financial interests of traditional school districts, to disfavor the financial interests of public schools of choice, and to characterize the two constituencies as essentially incompatible,” she wrote.
But the department’s spokesman, Elliot Krieger, struck a different tone when recently asked for an official statement in response to the report.
“RIDE recognizes that the funding formula for aid to education needs study and refinement. We completely agree with the recommendations of the Fair Funding Formula Special Commission. The funding formula needs further review, which should be balanced, reliant upon accurate data, and as committed to the accurate and precise identification of problems as it is to their correction. The special commission was successful in confirming the necessity of further study in the areas many of us have been discussing for months; we look forward to collaborating with legislators and with school district leaders in that process,” the statement read.
Charter school advocates respond to report
The head of one of the top education reform groups also signaled that she is open to revising the education funding formula—as long as the emphasis remains on student needs.
“Our funding formula was designed to focus on the needs of the student and to ensure that empty seats were not being funded as it has in the past. The commission reviewed a variety of expenses that go into calculating the per pupil allocation and identified places that districts incur costs that public charter schools do not and where public charter schools incur costs that districts do not. What needs to happen now is a thoughtful review of the formula so that it remains focused on the student. Per pupil dollars do not belong to a district or to a charter, they belong with the student,” said Christine Lopes Metcalfe, executive director of the Rhode Island Campaign for Achievement Now.
“The Funding Formula Commission’s work helped start an important public dialogue about the need for a thorough examination of the way all public schools in Rhode Island are funded—that includes charter public schools, traditional public schools, and career and technical schools. It’s critical that all stakeholders in public education have a voice in this process,” added Timothy Groves, the new executive director of the Rhode Island League of Charter Schools.
But Groves also sought to put the issue within its broader context. Charter schools account for 4.2 percent of the state’s total population of public school students, he noted, citing an April 2014 RIDE report. In terms of dollars, local cities and towns spent $1.2 billion on education in the 2012-2013 school year. Just under 2 percent of those funds went to charter schools, according to Groves.
He noted that there are some disparities that also work against charter schools. Funding for charter school facilities is capped at 30 percent while it starts at 35 percent for districts, he noted. In the current fiscal year, $1.4 million in housing aid went to charter schools, while districts got about $66.7 million, according to Groves.
“It’s clear that there is much work to be done before any responsible policy decisions can be made regarding public school funding. There may be some anomalies in the formula that have had unforeseen consequences in certain situations, but there are many factors in play that must be considered,” Groves said.
Related Slideshow: Charter School Costs to School Districts
The below data show one of the biggest areas of funding losses to charter schools: special education. The gap is demonstrated by comparing per pupil costs for special education for the district and charter schools. Despite having far lower costs, districts must pay tuition to charters as if their costs were the same, resulting in a potential overpayment to the charter and a loss of much-needed funding in the district. Those losses—due to special education alone, not other factors—are listed at the bottom of each slide. Only those districts that lost $50,000 or more are listed. Districts are listed in order of least to greatest losses. Financial data are from the report of the Rhode Island House of Representatives’ Special Commission to Study and Assess Rhode Island’s ‘Fair Funding Formula,’ released May 18. Attendance figures are from the Rhode Island Department of Education. All data are for fiscal year 2014.
NOTE: Total actual district losses displayed below are based on the difference for per-pupil special education cost for each charter school to which the district sent students. The average for all charters is shown here for illustrative purposes. Due to limited space, the averages for each charter that each district is sending students to are not shown. The total actual district losses were calculated as follows: The difference between each district’s per-pupil cost and each one of the charters to which it sent students was calculated. The difference was then multiplied by the number of students the district sent to that charter to calculate how much was being lost to each charter. The loss each district experienced for each charter was then added up to get the total amount that district was losing overall to charters.
Related Articles
- Public or Private: Charter Schools Can’t Have It Both Ways
- NEW: Online Charter School Opening in RI
- NEW: Letter to ACLU Claims Pool Closing Violates City Charter
- RI Charter Schools See Huge Increase in Applications
- NEW: Brown University to Partner with Prominent Charter School Organization
- LISTEN: The Highest Lowest Performing Charter Schools in RI
- Julia Steiny: A Charter School That Educates ALL Kids
- Julia Steiny: Can Charter Schools Save Providence?
- Commissioner Gist Recommends Closure of Failing Providence Charter School
- NEW: Supporters to Rally Against Charter School Closure
- The Top Charter Schools in Rhode Island
- NEW: ACLU Opposed to Providence City Charter Revision
- NEW: RI League of Charter Schools’ Nardelli to Retire, Groves Named Successor
- The Highest + Lowest Performing Charter Schools in RI
- Rhode Island Charter School Teacher Put on Leave After Whistleblowing
- Minimum Wage Increase Improved, Charter School Bill Passed: This Week at the State House
- GoLocalTV: Charter Schools Rally at RI State House for Public School Choice
- New Battle Between Unions and Charter Schools Emerges in RI
- RI Districts with the Most Money Lost to Charters
- It’s All About Education: Will Charter Schools Fix Our Public School System?
- The Scoop: City Employee’s Bid for City Council Violates Charter
- NEW: RI Charter Schools See Huge Increase in Applications
- CVS Caremark + Kimberly Clark Plant Garden At Highlander Charter
- RI School Districts Lose Millions to Charter Schools
- Beacon Charter to Honor John Chan for Contributions to the Arts


