
Providence is Ranked as One of the Worst Cities for Thanksgiving Travel
Tuesday, November 17, 2015
Next week, nearly 47 million Americans will travel for Thanksgiving, the most since 2007 according to AAA. Providence will be one of the most frustrating cities for travelers as it was ranked as the 21st worst city for holiday traffic by Google.
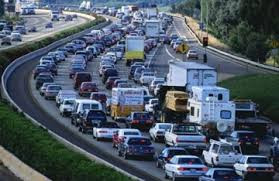
Google used anonymous traffic data from Android devices to come up with the rankings and other helpful tips about holiday travel. Los Angeles, California, was ranked as the worst city for holiday travel, joined in the top three by Washington, D.C., and San Francisco California.
Google also found that for most people, traveling on Tuesday could help save some time and frustration. Wednesday was ranked as the worst travel day for any city, except for Boston, who’s worst day is Tuesday, and Honolulu, Hawaii, Providence, and San Francisco, who’s worst day is Saturday.
GET THE LATEST BREAKING NEWS HERE -- SIGN UP FOR GOLOCAL FREE DAILY EBLASTAccording to AAA, driving remains the most popular mode of travel for Thanksgiving. Nearly 42 million Americans will take a road trip this Thanksgiving, a small increase in the amount of road travelers in 2014. In New England, more than two million residents are among those expected to travel, 1.8 million of them by car. Another 226,000 plan to fly to their vacation destinations.
“This Thanksgiving, the greatest number of Americans since 2007 will carve out time to visit family and friends,” said Lloyd P. Albert, AAA Northeast Senior Vice President of Public and Government Affairs. “While many people remain cautious about the economy and their finances, many thankful Americans continue to put a premium on traveling to spend the holiday with loved ones.”
Air travel is also expected to increase slightly, with 3.6 million Americans traveling by plane to their holiday destination. Other modes of transportation, including cruises, trains and buses, will decrease slightly this year.
Related Slideshow: The Communities with the Greatest Racial Disparities in Traffic Stops
The below slides show the racial disparities in traffic stops, ranking communities from least to greatest. For each community, the total number of stops is shown, along with the percentage of non-white drivers compared to the number of non-white drivers who are stopped. A racial disparity appears when the percentage of non-white drivers stopped exceeds the percentage of drivers who are non-white. Data is from a newly released report from the Institute on Race and Justice at Northeastern University. Data was collected by local law enforcement for traffic stops between January 2013 and May 2014. Note: Exeter and Block Island are not included in the report.


#37 Barrington
#36 West Greenwich
#35 Westerly
#34 Central Falls
#33 Bristol
#32 Coventry
#31 North Kingstown
#30 Warwick
#29 Burrillville
#28 East Greenwich
#27 East Providence
#26 Tiverton
#25 South Kingstown
#24 Little Compton
#23 Richmond
#22 Portsmouth
#19 Charlestown
#20 Narragansett
#19 Newport
#18 Glocester
#17 Scituate
#16 Smithfield
#15 Jamestown
#14 Warren
#13 Middletown
#12 Woonsocket
#11 Hopkinton
#10 West Warwick
#9 Cumberland
#8 Foster
#7 Pawtucket
#6 Johnston
#5 Lincoln
#4 North Providence
#3 Cranston
#2 North Smithfield
#1 Providence
Related Articles
- New England Vintage Chic: Five Tips For Smart Travelling
- SEEN: Travel Channel’s Andrew Zimmern + More
- Organize + Energize: Smart Packing For Spring Travel
- RI’s Communities as Art: Asher Schofield’s “Travel” Posters
- NEW: Providence Named Top Ice Cream City—Travel and Leisure
- Ocean House Named to Conde Nast Traveler’s Gold List
- NEW: TF Green Airport Ready for RI’s Thanksgiving Travel
- Tips for Traveling with Your Fine Jewelry
- Ocean House Named #4 Resort in the US—Travel + Leisure
- NEW: Providence Named Top Food City 2012 By Travel + Leisure
- NEW: RISD Library Named Most Beautiful in US—Travel + Leisure
- Travel + Leisure Names RI’s Ocean House + Weekapaug Inn Tops in US
- Thanksgiving Travel Expected to Decrease in RI This Year
- Update: Raimondo Lifts Travel Ban Starting 8 PM, Providence Schools Closed Tomorrow
- Raimondo Declares State Of Emergency, Travel Ban for Blizzard Juno
- AAA Travel Marketplace to Take Place March 6-8
- Over 37 Million Americans Expected to Travel this Memorial Day
- Most Traveled, Deficient Bridges in RI - See The List
- The Cellar: Traveling Loire
- NEW: Providence Named America’s Favorite City by Travel+Leisure
- Where Did Chafee Travel in 2013?
- Chafee Travel Costs RI Thousands in 2013
- NEW: Two Travel-Associated Chikungunya Cases Confirmed in Rhode Island
- Watch Hill’s Ocean House Named #5 Top Resort in the World By Travel+Leisure
- Elorza Travels to Guatemala to Meet with Discredited President
