PODCAST: RI Fishing Industry Faces Extinction with Fed Regulations
Thursday, December 12, 2013
GoLocalProv News Team
It's hard to image an Ocean State without a commercial fishing industry, but one local business owner warns it could happen.
Increasingly restrictive federal regulations have cut the commercial fishing fleet in half over the last four years and are imperiling its future, according to Richard Fuka, the president of the Rhode Island Fishermen's Alliance. Ron and Kate Nagle discuss.
GET THE LATEST BREAKING NEWS HERE -- SIGN UP FOR GOLOCAL FREE DAILY EBLAST
Related Slideshow: RI Fishing Industry’s Decline by the Numbers
The Rhode Island commercial fishing industry is in trouble. A study conducted in 2011 by Cornell University offered a portrait of an industry in crisis, with declines in sales, fishing vessels, and many types of permits. That study also showed how important the preservation of the fishing industry is to the state economy. Below are key figures on the decline and current state of the fishing industry in Rhode Island excerpted from the study. Some data is also taken from the National Oceanic and Atmospheric Administration.
 View Larger +
Prev
Next
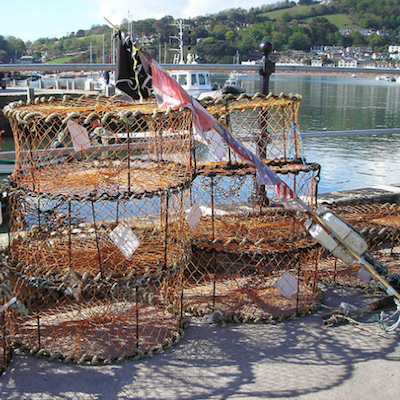
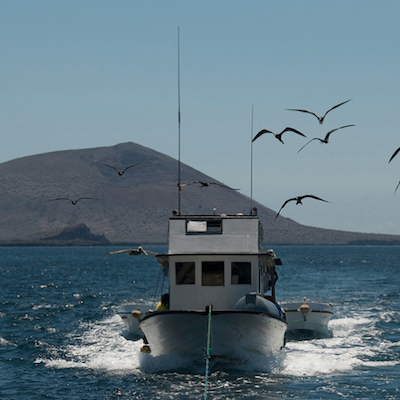
Sales from Catches
2006 to 2010 Change
Reduction: $38.1 million
Percent Change: 38.6%
2006 sales: $98.5 million
2010 sales: $60.4 million
Last year sales were below $60 million: 1982
1982 sales adjusted for inflation: $126 million
Source: Cornell University Cooperative Extension Marine Program
Photo: Flickr/kamsky
 View Larger +
Prev
Next
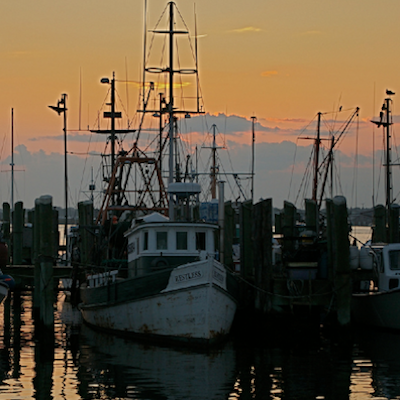
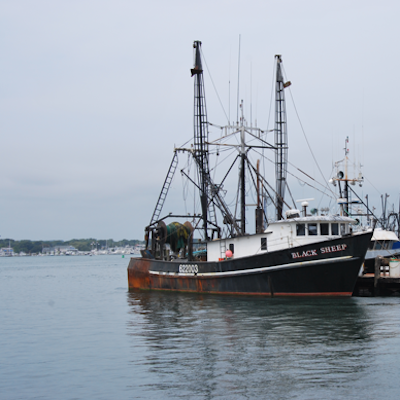
State-Licensed Boats
2005 to 2011 Change
Decline in # of Licensed Vessels: 190
Percent Change: -12.7%
Number of State-Licensed Vessels
2005: 1,488
2011: 1,298
Source: Cornell University Cooperative Extension Marine Program
 View Larger +
Prev
Next
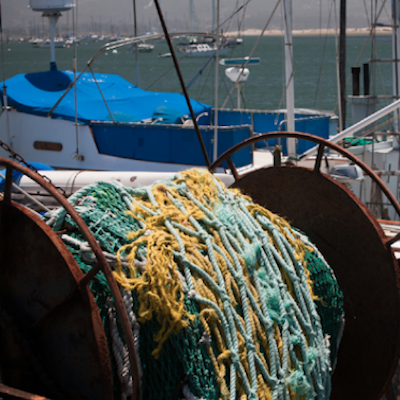
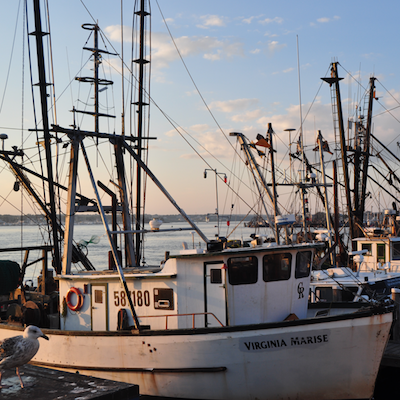
State Licenses Issued
Multi-purpose License
2006 to 2011 Change
Decline in # of Licenses: 150
Percent change: -14.7%
Number of State Licenses Issued By Year
2006: 1,017
2007: 973
2008: 939
2009: 917
2010: 887
2011: 867
Source: Cornell University Cooperative Extension Marine Program
Photo: Flickt/Eric Molina
 View Larger +
Prev
Next
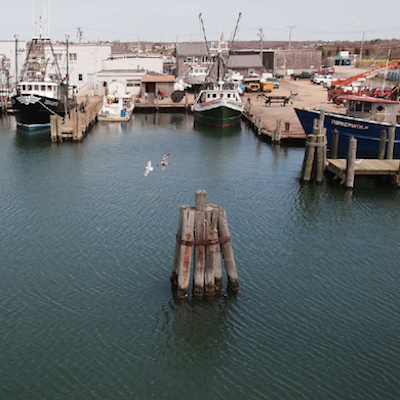
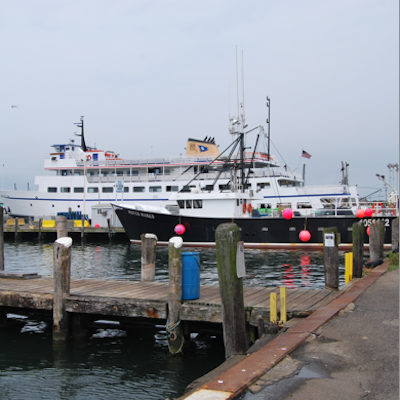
Federally-Licensed Boats
Decline in # of Licensed Vessels: 8
Percent Change: -2.1%
Number of Federally-Licensed Boats
2005: 367
2010: 359
Source: Cornell University Cooperative Extension Marine Program
Photo: Flickr/James Brooks
 View Larger +
Prev
Next
Groundfishing Vessels '09
Point Judith Total: 32
Rhode Island Total: 60
Connecticut Total: 8
Massachusetts Total: 312
Northeast Total: 570
Note: Groundfish are those that dwell on the bottom of the sea. They include fish such as cod, halibut, haddock, and flounder. The Northeast includes the coastal New England states along with New York and New Jersey. Only those vessels that had revenue from at least one groundfish trip are counted.
Source: NOAA
Photo: Flickr/Liz West
 View Larger +
Prev
Next
Groundfishing Vessels '11
Point Judith Total: 28
Rhode Island Total: 49
Connecticut Total: 5
Massachusetts Total: 224
Northeast Total: 420
Note: Groundfish are those that dwell on the bottom of the sea. They include fish such as cod, halibut, haddock, and flounder. The Northeast includes the coastal New England states along with New York and New Jersey. Only those vessels that had revenue from at least one groundfish trip are counted.
Source: NOAA
Photo: Flickr/bob19156
 View Larger +
Prev
Next
Groundfishing Vessels % Decline
% Change 2009-20011
Point Judith: -12.5%
Rhode Island: -18.3%
Connecticut: -37.5%
Massachusetts: -28.2%
Northeast Total: -26.3%
Note: Groundfish are those that dwell on the bottom of the sea. They include fish such as cod, halibut, haddock, and flounder. The Northeast includes the coastal New England states along with New York and New Jersey. Only those vessels that had revenue from at least one groundfish trip are counted.
Source: GoLocalProv analysis of NOAA data.
Photo: Flick/NickSarebi
 View Larger +
Prev
Next
Groundfishing Value
Change 2007 to 2010: -$7.8 million
Percent Change 2007 to 2010: -22.4%
Values by Year
2007: $34.7 million
2008: $30.8 million
2009: $23.5 million
2010: $26.9 million
Note: Above data is for groundfishing by permitted vessels which are home-ported in Rhode Island. Annual data corresponds to the fishing year, which is from May 1 of one calendar year to April 30 of the next.
Source: Cornell University Cooperative Extension Marine Program
Photo: Flickr/BrianPocius
 View Larger +
Prev
Next
Groundfishing Jobs
Change 2007 to 2010: -48
Percent Change 2007 to 2010: -15.9%
Number of Crew Positions by Year
2007: 301
2008: 278
2009: 268
2010: 253
Note: Data above are the totals for the Rhode Island home-ported vessels engaged in groundfishing. Annual data corresponds to the fishing year, which is from May 1 of one calendar year to April 30 of the next.
Source: Cornell University Cooperative Extension Marine Program
Photo: Flickr/Ted Kerwin
 View Larger +
Prev
Next
Groundfishing Trips
Change 2007 to 2010: -3,492
Percent Change 2007 to 2010: -21.3%
Number of Crew Positions by Year
2007: 16,353
2008: 14,515
2009: 13,676
2010: 12,861
Note: Crew trips provide an indicator of changes in earnings, as crew members are typically paid per trip. A decline in trips corresponds to a decline in opportunities to share in trip earnings. Data above are the totals for the Rhode Island home-ported vessels engaged in groundfishing. Annual data corresponds to the fishing year, which is from May 1 of one calendar year to April 30 of the next.
Source: Cornell University Cooperative Extension Marine Program
Photo: Flickr/Mike Baird
 View Larger +
Prev
Next
Fish Sales: Economic Value
Total Contribution in 2010
Sales: $150.3 million
Income: $106.3 million
Jobs: 4,968
Economic Areas Benefitting
Harvesting
Primary Dealers/Processors
Restaurants
Grocers
Note: Data shows the economic contributions of sales from catches that are sold in Rhode Island to the state economy. Complete data over a period of time was not available from the sources used. The data is meant simply to show the importance of the fishing industry to the overall economy.
Source: Cornell University Cooperative Extension Marine Program
Photo: Flickr/vv@ldzen
 View Larger +
Prev
Next
Fish Sales: Value to Restaurants
Economic Contributions in 2010
Sales: $8.7 million
Income: $5.2 million
Jobs: 2,811
Note: Data shows the economic contributions of sales from catches that are sold in Rhode Island to the state economy. The specific contribution made to the restaurant industry is shown above. Complete data over a period of time was not available from the sources used. The data is meant simply to show the importance of the fishing industry to the overall economy.
Source: Cornell University Cooperative Extension Marine Program
Photo: Flickr/A. Davey
 View Larger +
Prev
Next
Commercial Fishing: Total Economic Value
Comprehensive Estimate of Commercial Fishing’s Total Contribution to RI Economy in 2010
Sales: $763.3 million
Income: $239.9 million
Jobs: 8,995
Note: Data shows the total contribution the commercial fishing industry makes to the Rhode Island economy. Complete data over a period of time was not available from the sources used. The data is meant simply to show the importance of the fishing industry to the overall economy.
Source: Cornell University Cooperative Extension Marine Program
 View Larger +
Prev
Next
Commercial Fishing: Value to Restaurants
Comprehensive Estimate of Commercial Fishing’s Total Contribution to the Restaurant Industry in 2010
Sales: $34.9 million
Income: $57.6 million
Jobs: 2,811
Note: Data shows the total contribution the commercial fishing industry makes to the Rhode Island economy. Above, the specific contribution the commercial fishing industry makes to the restaurant industry is shown. Complete data over a period of time was not available from the sources used. The data is meant simply to show the importance of the fishing industry to the overall economy.
Source: Cornell University Cooperative Extension Marine Program
 View Larger +
Prev
Next
RI Seafood Industry Job Decline
Seafood Commercial Establishments and Employees
Change from 2005 to 2008
Change in # Establishments: -6
Change in # Employees: -63
Changes in Jobs by Year
2005: 714
2006: 646
2007: 602
2008: 651
Source: Cornell University Cooperative Extension Marine Program
Related Articles
Enjoy this post? Share it with others.