
NEW: RI ACLU Announces Racial Disparities Increasing During Motor Vehicle Stops
Monday, December 15, 2014
The American Civil Liberties Union (ACLU) of Rhode Island announced that racial disparities in searches during motor vehicle stops appear to be increasing in the state.
In 2003, 2006 and 2014, Northeastern University released three separate studies analyzing racial disparities in traffic stops and searches made by each of Rhode Island’s police departments. The data released today by the ACLU compared rates of what are called “discretionary searches,” or all searches that are not incident to arrest.
The ACLU believes that this most recent analysis indicates that the racial disparities in discretionary searches are not only continuing, but in many cases increasing.
GET THE LATEST BREAKING NEWS HERE -- SIGN UP FOR GOLOCAL FREE DAILY EBLAST“Ten years since racial profiling was prohibited by law, this data is both alarming and disheartening. Black and Hispanic drivers remain disproportionately searched by law enforcement, even though Northeastern University’s analysis demonstrates that white drivers are more likely to be found with contraband when searched,” says Hillary Davis, ACLU of Rhode Island policy associate. “As a result, these searches are both discriminatory and ineffective. A decade’s worth of conversations between law enforcement and the community have not resolved these disparities, and it is time for law enforcement to employ new means to ensure Rhode Islanders receive equal treatment in their interactions with the police.”

Of the ten Rhode Island police departments that stopped more than 2,000 individuals and/or engaged in more than 100 discretionary searches in 2004-2005, the data indicates that nine have seen a subsequent increase in the racial disparity of such searches.

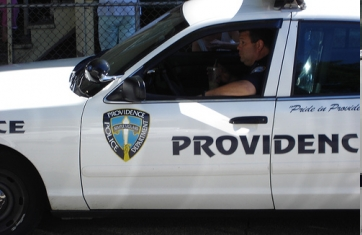
And, of the ten Rhode Island police departments that have seen an increase in racial disparity during searches since 2001-2002 include: Cranston, East Providence, North Kingstown, Providence, Woonsocket and the State Police. while Pawtucket and South Kingstown have seen an increase in this disparity since 2004-2005.
The ACLU believes that this analysis comes as part of a forthcoming larger analysis of racial disparities across Rhode Island, including in arrest rates and school suspension rates.
For more informaton or to become a member of the ACLU please contact Hillary Davis at 401-831-7171.
Related Slideshow: The Communities with the Greatest Racial Disparities in Traffic Stops
The below slides show the racial disparities in traffic stops, ranking communities from least to greatest. For each community, the total number of stops is shown, along with the percentage of non-white drivers compared to the number of non-white drivers who are stopped. A racial disparity appears when the percentage of non-white drivers stopped exceeds the percentage of drivers who are non-white. Data is from a newly released report from the Institute on Race and Justice at Northeastern University. Data was collected by local law enforcement for traffic stops between January 2013 and May 2014. Note: Exeter and Block Island are not included in the report.


#37 Barrington
#36 West Greenwich
#35 Westerly
#34 Central Falls
#33 Bristol
#32 Coventry
#31 North Kingstown
#30 Warwick
#29 Burrillville
#28 East Greenwich
#27 East Providence
#26 Tiverton
#25 South Kingstown
#24 Little Compton
#23 Richmond
#22 Portsmouth
#19 Charlestown
#20 Narragansett
#19 Newport
#18 Glocester
#17 Scituate
#16 Smithfield
#15 Jamestown
#14 Warren
#13 Middletown
#12 Woonsocket
#11 Hopkinton
#10 West Warwick
#9 Cumberland
#8 Foster
#7 Pawtucket
#6 Johnston
#5 Lincoln
#4 North Providence
#3 Cranston
#2 North Smithfield
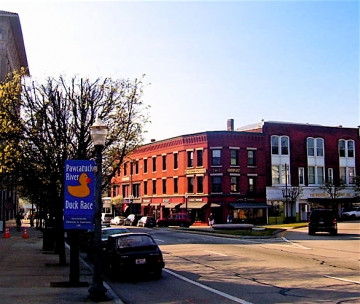
#1 Providence
Related Articles
- Brown Research: Racial Bias in Nursing Homes
- NEW: Groups to March in Support of Racial Profiling Prevention Bill
- Study Finds Racial Gaps Putting RI’s Economy, Future at Risk
- NEW: Groups Slam Police Chiefs for Opposing Racial Profiling Bill
- NEW: Lawmakers Unveil Racial Profiling Bill
- Ugly incident at Providence goes way beyond racial tension
- Scholar Ronald Ferguson To Speak on Racial Achievement Divide at Brown
- Racial Profiling Bill Stalled in Committee
- NEW: Marijuana Arrest Rates Racially Disparate Toward Blacks
- NEW: Fung Volunteer Tweets Racial Comments About Obama
- State Report: Racial Profiling, Master Lever Ban + 38 Studios
- NEW: Fung Responds to Supporter’s Racial Tweets about Obama
- State Report: Racial Profiling, Teacher Evaluations + Food Labels
- Group Accuses RI Schools of Racial Profiling
- Nicole Haslinger: Zimmerman + Racial Profiling in Rhode Island
