
Providence Cocaine Dealer Sentenced to 3 Years in Federal Prison
Friday, July 17, 2015
Kendall Ferrara, a 33-year-old man from Providence, was sentenced this week to three years in federal prison for trafficking crack cocaine in and around the Providence area.
At sentencing, U.S. District Court Judge Mary M. Lisi also ordered Ferrara to serve three years of supervised release upon completion of his prison term. Ferrara pleaded guilty on April 6, 2015, to one count of distribution of crack cocaine.
About the Arrest
GET THE LATEST BREAKING NEWS HERE -- SIGN UP FOR GOLOCAL FREE DAILY EBLASTAccording to court documents, an undercover FBI Safe Streets Violent Gang Task Force investigation in the fall of 2014 into drug trafficking activities in and around Providence included five purchases of crack cocaine in varying amounts from Ferrara between October 10 and November 21, 2014. The purchases totaled nearly 59 grams of crack cocaine.
Ferrara was arrested by members of the FBI Safe Streets Task Force on February 23, 2015.
The FBI’s Safe Streets Violent Gang Task Force consists of agents and law enforcement officers from the FBI, RI State Police, Providence, Cranston, Woonsocket, Johnston and Central Falls Police Departments and the RI Adult Corrections Institutions.
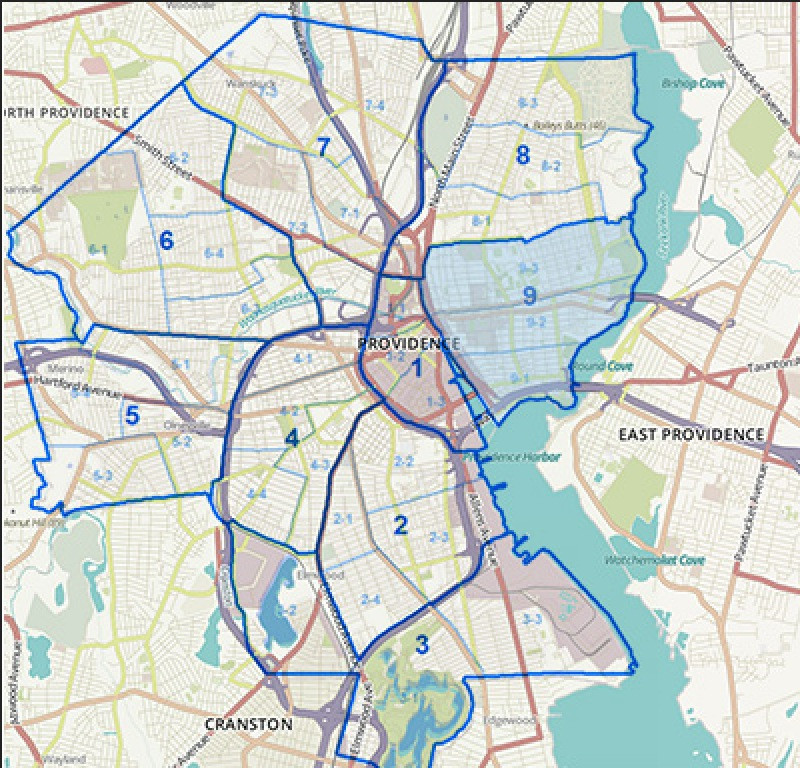
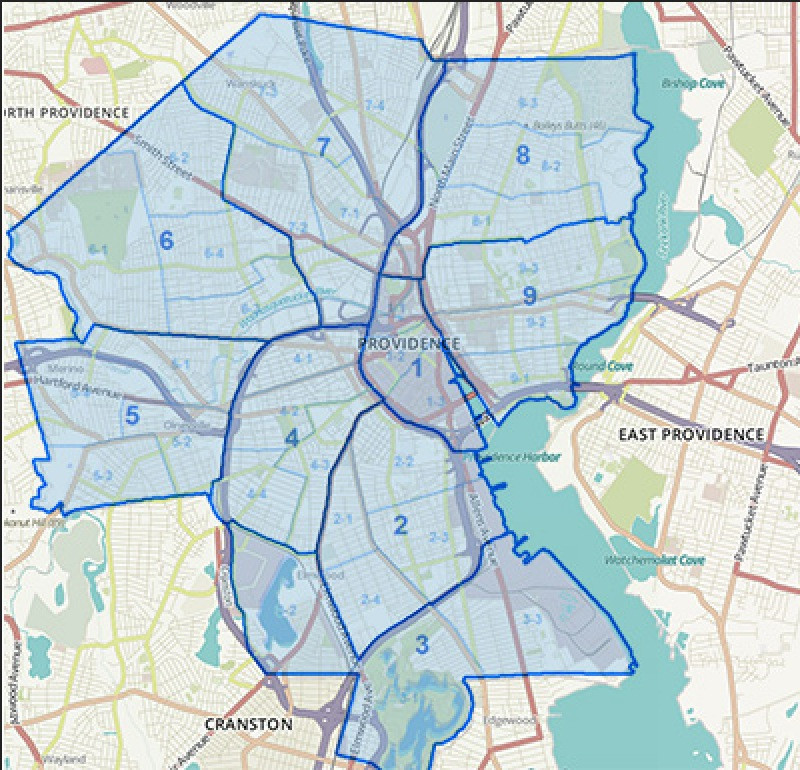
Related Slideshow: Providence’s Most Violent Neighborhoods
Each week, the Providence Police Department releases its "Weekly Crime Comparison Report" on its website. The breakdown covers how many crimes have occured in the past week, past month, and year to date in each Police District and comparing them with the same time interval from the year prior, reflecting changes in crime rates. GoLocal has distilled the key data points from this weeks report to reflect YTD crime data grouped by general category- violent, property, other, and total. For the full report as filed by the PPD, click here.


Related Articles
- Rhode Island’s Most Violent Cities and Towns: FBI Crime Data
- FBI Report: Crime on the Rise in Providence
- NEW: Speaker Fox’s State House Office Raided by FBI, State Police
- Leonardo Angiulo: A Good Day for FBI, A Bad Day for Politicians
- FBI, Police Seek Suspect in Islamic School Vandalism, Offer Reward
- RI’s Most Violent Cities and Towns: New FBI Crime Data
- Moore News: FBI creates Fake News Story to nab suspect
- FBI Charges Top FIFA Execs - What Does This Mean for Soccer?
- NEW: Video Of Boston Marathon Bombing Suspects Released by FBI
- Crime in Providence: Top Stories in RI in 2012
- Crime-Counting Controversy on New England’s College Campuses
- RI Legislators Push for Criminal DNA Sampling in Violent Crimes
- Carol Anne Costa: Raimondo Steps Up For Crime Victims
- Dan Lawlor: Providence Shouldn’t be a Crime Scene
- Providence Data Flag Crime as Biggest Threat
- Travis Rowley: The Hate-Crime Hoax–A Liberal Pastime
- Guest MINDSETTER™ Richard Ferruccio: Cost of Incarceration vs. the Cost of Crime
- Hodgson Blasts Kilmartin For Breaking Crime Lab Promise
- East Side of Providence Rocked by Crime
- A Breakdown of Hate Crimes in the United States
- Tom Finneran: The Crime of the Century
