
25% of Female Brown Students Reported “Unwanted Sexual Touching” in Survey
Tuesday, September 22, 2015
According to new survey data released by Brown University, since starting college, 25 percent of Brown undergraduate women and 6.8 percent of undergraduate men who participated in the survey experienced either unwanted sexual touching or attempted or completed penetration due to physical force or incapacitation.

Brown released the data Monday from from the Report on the AAU Campus Climate Survey on Sexual Assault and Sexual Misconduct gathered through surveys in April 2015 by Westat, an independent national research company. Brown was part of a 27-institution survey organized by the Association of American Universities (AAU).
“For Brown, the report reinforces our Sexual Assault Task Force’s call to action for confronting the very real problem of gender-based harassment and violence,” Brown President Christina Paxson said. “The results of the survey establish a clear baseline against which we can assess ourselves going forward and will continue to inform ongoing education and prevention efforts to address these problems.”
GET THE LATEST BREAKING NEWS HERE -- SIGN UP FOR GOLOCAL FREE DAILY EBLASTOngoing Attention to Sexual Assault on Campus
According to Brown, the university has been working to transform its approach to sexual violence coinciding with campus activism on this issue since early 2014.
A Sexual Assault Task Force of faculty, students and staff submitted its final report at the end of the last academic year, and according to Brown officials, many of its recommendations already are in effect.
“Brown has come a long way since the AAU survey was conducted last April,” Paxson said in her email to the campus. “The data in the AAU report have revealed areas for ongoing attention, including education about available support resources and greater clarity around our procedures. While we have increased the transparency of our complaint process through the use of trained investigators and specified timeframes for each step, we are working to ensure the information is clear and accessible to the entire campus.”
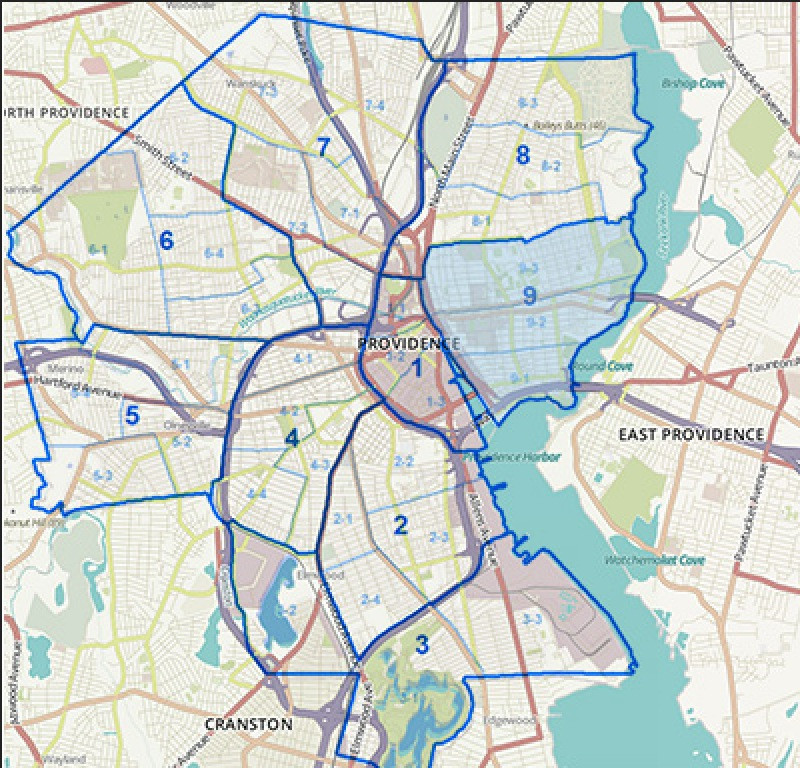
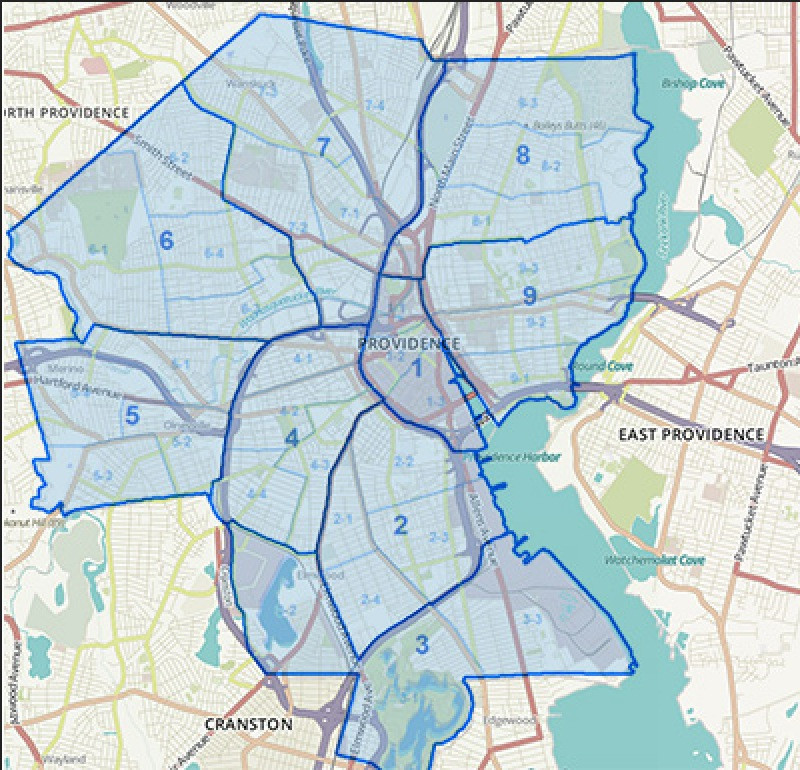
Related Slideshow: Providence’s Most Violent Neighborhoods
Each week, the Providence Police Department releases its "Weekly Crime Comparison Report" on its website. The breakdown covers how many crimes have occured in the past week, past month, and year to date in each Police District and comparing them with the same time interval from the year prior, reflecting changes in crime rates. GoLocal has distilled the key data points from this weeks report to reflect YTD crime data grouped by general category- violent, property, other, and total. For the full report as filed by the PPD, click here.


Related Articles
- Brown Basketball Adds Six to 2015-16 Roster
- Brown University Grad Rafael Maia Takes 5th Year at Pitt
- Jordan Spieth, Brother of Brown’s Steven Spieth, Wins U.S. Open
- GoLocalTV: Brown University Alums in the 2016 Presidential Race
- Brown’s Hazeltine to be Inducted into RI Entrepreneurship Hall of Fame
- Brown Lax Falls to Denver 15-9 in NCAA Tournament First Round
- Brown U. Set to Host Ivy League Lacrosse Tournament
- Patriots Select Malcom Brown In 1st Round of NFL Draft
- Brown Lax Earns 1st NCAA Tourney Berth Since 2009
- NEW: Brown’s Clavette Signs With Tampa Bay
- Brown Football Schedule Released, Play URI for 100th Time
- Brown Football Alum Cruz Signs With the Chicago Bears
- Brown Women’s Soccer Coach Pincince to Retire After Season
- Brown Grad James Develin Suffers Broken Leg Against Panthers
- Brown Basketball to Host URI, Visit Georgetown in 2015-16 Season
- Brown Football Set to Host Bryant in Season Opener
- Bishop: Constitution Day at Brown - What’s the State of Our More Perfect Union?
- Brown Males Have 12th Most Right Swipes in Country on Tinder
- Brown Coach Martin to be Inducted to New England Basketball Hall of Fame
- Patriots Develin 1 of 4 Brown Alums in NFL
- Brown Football Picked to Finish 5th in Ivy League
- Brown Grad Williams Elevated to Bishop Designate
- Bryant Edges Brown 20-16
