Most Dangerous Intersections in New England
Monday, February 24, 2014
Kate Nagle, GoLocalProv Contributor
Where are New England's most dangerous intersections?
Whether you're traveling on I-95, heading to the mountains or the beaches, or commuting to urban centers, there are thousands of intersections where accidents can -- and do occur -- throughout the region.
See New England's 60 Most Dangerous Intersections BELOW
GoLocal looked at the most available data available from each of the six England states to see where the accidents were that caused the most property damage, injury, or death to determine the 10 most dangerous intersections in each state and the 60 most dangerous intersections in all of New England. See GoLocal's methodology here.
GET THE LATEST BREAKING NEWS HERE -- SIGN UP FOR GOLOCAL FREE DAILY EBLAST
Together, the 60 most dangerous intersections accounted for over 5,000 accidents, more than 3,000 injuries -- and over 30 with fatalities.
"From a national perspective, New England roads aren't the most dangerous roads," said Ted Miller with the Pacific Institute for Research and Evaluation, which has offices in ten states, including Rhode Island. "Those tend to be down south, and in Hawaii in particular, due to tourists driving on roads they're not familiar with."
Miller said, "Overall, we're seeing fatality crash counts continue to decline. We look at the kinds of crashes that occur, and counter-measures to reduce those kinds of crashes, from putting in stoplights and stop signs, to addressing curves and shoulders."
Kevin Nursick with the Connecticut Department of Transportation addressed what he saw as an issue with identifying dangerous roads.
"One of the difficulties we have trying to reduce crashes is trying to deal with a public perception that somehow the roads are the cause of the crashes," said Nursick. "Realistically there's no such thing as a dangerous road, and statistics prove that 95% plus of crashes are a result of driver error. I don't care if you have perfectly straight or flat roads, or curvatures."
"If you follow the rules of the road, and the posted signage, you shouldn't have any problem navigating. It's the cooperation and responsibility of everyone on the roadway, including pedestrians, bicyclists," said Nursick. "The more we have that approach that the roads are dangerous, the more we empower people to drive recklessly."
Addressing Problem Intersections
"The mentalities are changing in building roads," said Nursick. "We used to build the most ideal conditions -- flat, straight, with nice wide lanes, shoulders, sight lines. We found that people feel so comfortable, that they drive like maniacs. When we give an irresponsible motorist a "perfect" road -- you're doing 55 [MPH] on a road with a 40 [MPH] posting . You can see perfectly comfortably, so people then are texting and driving."
See Connecticut's most Dangerous intersections HERE.
Nursick continued, "Now the trend is a new design principle where you build traffic calming measures. With newer designs, we'll put in center medians, lower plantings around the side of the road, narrower travel lanes -- things that make you pay attention. In a perfect world, the perfect infrastructure works great -- the fact of the matter is, the motorist refuse to obey the rules of the roads."
Duane Brunell with the Maine Department of Transportation addressed the issue of problematic areas.
"We don't classify roads as most dangerous," said Brunell. "It's kind of a popular topic, but it's not a black or white one."
"You're always trying to prioritize," said Brunell. "For instance, we look, where reasonable, for roundabout possibilities. They only go one direction, you eliminate T-Bone crashes, get lower speeds. You might get some rear ends, but they're a good solution. It's an expensive option -- there might be property issues involved. You've got to pick your opportunities."
See Maine's Most Dangerous Intersections HERE
Russ Rader at the Insurance Institute for Highway Safety said that among intersection issues it looks at, that "running the red" was one of the biggest ones.
"One of the biggest factors in intersection crashes involves red light running," said Rader. Some states are being more aggressive red light cameras, which can improve the conditions. There's concrete data that red light cameras reduce accidents."
Rader, like Maine's Brunell, saw roundabouts as a top option. "The best thing to do with intersection safety is to use roundabouts instead. Not all can be converted to a roundabout, you need space for them. Putting them in in the first place is the best way to go; but there have been conversions....they are intuitively user friendly, and one things that makes them popular is that they keep traffic moving."
"There are less costly ways -- protected left turns -- using an arrow signal to let them turn left, to protect them from oncoming traffic. Things as simple as moving a bus stop can help," said Rader. "It's hard to compare states by number of crashes, because they'll vary by rural and urban areas."
Focus on Driver Responsibility
In July 2013, Rhode Island released its Highway Safety Plan for Fiscal Year 2014, with a mission to reduce the number of fatalities and serious injuries on Rhode Island’s roadways; and to reduce the number of traffic crashes and the severity of their consequences.
See Rhode Island's Most Dangerous Intersections HERE
The Rhode Island Department of Transportation worked with community experts and stakeholders in the creation of the plan, including AAA of Southern New England.
"We're a stakeholder in the creation of the plan, we get involved with others on a host of issues," said Lloyd Albert, Senior Vice President at AAA. "Among the areas of focus are teen driver safety, how they're licensed and brought online. The fatalities aren't hight, but there are a lot of fender benders."
"We also look at seniors, and the aging population," continued Albert. "Most drivers outlive their safe driving age by 7 or 8 years. We provide driving improvement classes. They're about 8 hours, free of charge. We take groups, whether in their 60s, 70s, 80s, trying to help them, and tips to be a better and safer driver. We provide software to keep seniors brain functioning at as high level as possible."
Among the intersections identified as being most dangerous was on Rt. 138 Hopkinton, due to a crash with high fatalities there recently.
"There was a very bad accident there a few years back, due to excessive speed, but in general that's not an area of concern," said Hopkinton Chief of Police David Palmer. The Hopkinton Police Department noted on its website that stop signs are being installed at the intersection of Fairview Avenue. and Dye Hill Road.
"We did put a stop sign there because of resident input," said Palmer. "A woman who lived in the neighborhood contacted us. There's a school bus stop there, so we investigated, and brought it to the town council. We get a lot of input from residents. We also bring things to the state's attention, they'll come and do studies based on the investigation. In general, people want signs, and they'll express concerns for speeding."
In New Hampshire, which had only 10 intersections ranking in the top 60 in New England -- and none in the top 20 -- an initiative called "Driving Towards Zero" is focusing on identifying and creating opportunities for changing American culture as it relates to highway safety; the New Hampshire Traffic Safety Institute offers courses in defensive driving to promote safer highways through education.
See Most Dangerous Intersections in New Hampshire HERE
Change in Data Reporting
Until last year, the U.S. Department of Transportation's Federal Highway Administration compiled it's so-called "5 Percent Report" each year based on data received from each state describing at least 5 percent of its locations currently exhibiting the most severe highway safety needs. The crash statistics take into account the total number of crashes, number of fatalities, number of crashes that resulted in injury, and number of property damage only crashes for the most recent three year period of each state's reporting.
Under new federal transportation legislation signed into law last year, states are no longer required to report under the previous 5% requirement, although some projects funded are still impacted.
“In general, the Moving Ahead for Progress in the 21st Century Act (MAP-21) eliminates the High Risk Rural Roads (HRRR) Program and no longer requires states to submit a transparency (5 percent) report. However, because HRRR funds apportioned under the Safe, Accountable, Flexible, Efficient Transportation Equity Act: A Legacy for Users Act ( SAFETEA-LU) are subject to the SAFETEA-LU HRRR requirements, States must continue reporting on HRRR expenditures under SAFETEA-LU as part of their HSIP reports," said Neil Gaffney with the Federal Highway Administration.
"I don't think it was any info of use," said Connecticut's Nursick. "It was part of the old transportation bill. It was telling you things you already knew. It was viewed from a transparency standpoint, to talk about high frequency crash locations -- does that equate to safety? Absolutely not."
"All of our crash data is available to the public, media -- it's public, it's all out there. I've been here ten years," said Nusick. I'm a communications guy -- I try to keep people in touch with reality."
MassDOT Highway Division obtains crash data from the Massachusetts Registry of Motor Vehicles (RMV) and uses it for many purposes, with the "primary function is to provide the foundation for developing safety improvement projects."
See Massachusetts Most Dangerous Intersections HERE
Bruce Nyquist with the Vermont Agency of Transportation told GoLocal, "Intersections are included in our infrastructure plan, and are still identified as a top priority."
The data driven approach as yielded benefits in Vermont, according to Nyquist. "Regarding intersection crashes, our first plan was in 2006. The info that we have from the five year average through 2011 is that crashes have gone down 8%."
See Vermont's Most Dangerous Intersections HERE
Related Slideshow: 60 Most Dangerous Intersections in New England - 2014
Using the most recent available data, GoLocalProv has compiled a list of the Most Dangerous Intersections in New England.
See the methodology here
Since different states chose different time spans in which to accumulate their data (3-10 years), GoLocal standardized the tallies to a 3-year sum.
 View Larger +
Prev
Next
#60
Seymour, CT
Rt. 8 MM 18.58-18.81
Total Crashes: 11
Fatal Crashes: 0
Injury Crashes: 5
Crashes with Property Damage Only: 6
Source: CT DOT
 View Larger +
Prev
Next
#59
Wethersfield, CT
Rt. 287 Mile Marker 1.58 (Near Rte 287 + Merritt Parkway)
Total Crashes: 22
Fatal Crashes: 0
Injury Crashes: 6
Crashes with Property Damage Only: 16
Source: CT DOT
 View Larger +
Prev
Next
#58
Vernon, CT
Rt. 83 Mile Marker 11.80-11.89 (Route 83 + Route 30)
Total Crashes: 25
Fatal Crashes: 0
Injury Crashes: 7
Crashes with Property Damage Only: 18
Source: CT DOT
 View Larger +
Prev
Next
#57
Hudson, NH
NH 111 (Ferry St.) + NH 3A (Chester St./Derry Rd.)
Total Crashes: 27.6
Fatal Crashes: 0
Injury Crashes: 7.5
Crashes with Property Damage Only: 20.1
Source: NH DOT
 View Larger +
Prev
Next
#56
Tilton, NH
US 3 (Laconia Rd.) + NH 140 (Tilton Rd.)/1-93 NB Ex 20 Ramps)
Total Crashes: 20.7
Fatal Crashes: 0
Injury Crashes: 8.7
Crashes with Property Damage Only: 12
Source: NH DOT
 View Larger +
Prev
Next
#55
Nashua, NH
Main St. + Canal St./Franklin St.
Total Crashes: 24.6
Fatal Crashes: 0
Injury Crashes: 9.3
Crashes with Property Damage Only: 15.3
Photo: Flickr/Bettyx1138
Source: NH DOT
 View Larger +
Prev
Next
#54
Nashua, NH
Main St. + NH 111 (Spring St./Kinsley St.)
Total Crashes: 23.1
Fatal Crashes: 0
Injury Crashes: 9.6
Crashes with Property Damage Only: 13.5
Source: NH DOT
 View Larger +
Prev
Next
#53
Salem, NH
NH 28 (N/S Broadway) + NH 38/NH 97 (Main St.)
Total Crashes: 22.5
Fatal Crashes: 0
Injury Crashes: 10.2
Crashes with Property Damage Only: 12.3
Source: NH DOT
 View Larger +
Prev
Next
#52
Bridgeport, CT
Rt. 127 Mile Marker 1.02 (Rte 127 + Stillman St)
Total Crashes: 18
Fatal Crashes: 0
Injury Crashes: 11
Crashes with Property Damage Only: 7
Source: CT DOT
 View Larger +
Prev
Next
#51
Concord, NH
NH 9 (Loudon Rd.) + D'Amante Dr. (Steeplegate Mall)
Total Crashes: 21.6
Fatal Crashes: 0
Injury Crashes: 10.5
Crashes with Property Damage Only: 11.1
Source: NH DOT
 View Larger +
Prev
Next
#50
Williston, VT
94 US-2 + VT-2A
Total Crashes: 43.8
Fatal Crashes: 0
Injury Crashes: 8.4
Crashes with Property Damage Only: 38.4
Source: VT DOT
 View Larger +
Prev
Next
#49
Manchester, NH
Bridge St. + NH 285 (Beech St.)
Total Crashes: 20.7
Fatal Crashes: 0
Injury Crashes: 12.6
Crashes with Property Damage Only: 8.1
Source: NH DOT
 View Larger +
Prev
Next
#48
Concord, NH
NH 9 (Loudon Rd.) + Fort Eddy Rd./I-93 NB Ex 14 Off-Ramp
Total Crashes: 29.4
Fatal Crashes: 0
Injury Crashes: 11.7
Crashes with Property Damage Only: 17.7
Source: NH DOT
 View Larger +
Prev
Next
#47
Berlin, VT
23 VT-62 + Berlin State Highway: Fisher Rd.
Total Crashes: 37.2
Fatal Crashes: 0
Injury Crashes: 10.2
Crashes with Property Damage Only: 30
Source: VT DOT
 View Larger +
Prev
Next
#46
Bridgeport, CT
Rt. 127 Mile Marker .64 (Rte 127 + Barnum Ave)
Total Crashes: 31
Fatal Crashes: 0
Injury Crashes: 12
Crashes with Property Damage Only: 19
Source: CT DOT
 View Larger +
Prev
Next
#45
Nashua, NH
Main St. + East Hollis St./West Hollis St.
Total Crashes: 24.9
Fatal Crashes: 0
Injury Crashes: 14.1
Crashes with Property Damage Only: 10.8
Source: NH DOT
 View Larger +
Prev
Next
#44
Burlington, VT
11 US-7 + Main St., US-2
Total Crashes: 49.2
Fatal Crashes: 0
Injury Crashes: 10.2
Crashes with Property Damage Only: 42
Source: VT DOT
 View Larger +
Prev
Next
#43
Waterbury, CT
Rt. 69 MM 18.39-18.49
Total Crashes: 55
Fatal Crashes: 0
Injury Crashes: 14
Crashes with Property Damage Only: 41
Source: CT DOT
 View Larger +
Prev
Next
#42
Portland, ME
Fort Ave., Hartley St. + Forest Ave., Holly St.
Total Crashes: 45
Fatal Crashes: 0
Injury Crashes: 21
Crashes with Property Damage Only: 23
Source: ME DOT
 View Larger +
Prev
Next
#41
Portland, ME
Fore River Pkwy. + Valley St., W. Commercial St.
Total Crashes: 64
Fatal Crashes: 0
Injury Crashes: 18
Crashes with Property Damage Only: 46
Source: ME DOT
_400_400_90.jpeg) View Larger +
View Larger +
Prev
Next
#40
Manchester, NH
NH 285 (Beech St.) + Cilley Rd.
Total Crashes: 20.4
Fatal Crashes: 0
Injury Crashes: 23.4
Crashes with Property Damage Only: 8.7
Source: NH DOT
 View Larger +
Prev
Next
#39
Portland, ME
Allen Ave., Entrance to McDonalds + Z Rd., Forest Ave.
Total Crashes: 58
Fatal Crashes: 0
Injury Crashes: 20
Crashes with Property Damage Only: 38
Source: ME DOT
 View Larger +
Prev
Next
#38
Westbrook, ME
Cumberland St. + Warren Ave.
Total Crashes: 83
Fatal Crashes: 0
Injury Crashes: 17
Crashes with Property Damage Only: 66
Source: ME DOT
 View Larger +
Prev
Next
#37
Wallingford, CT
Rt. 5 MM 9.35-9.36
Total Crashes: 51
Fatal Crashes: 0
Injury Crashes: 22
Crashes with Property Damage Only: 29
Source: CT DOT
 View Larger +
Prev
Next
#36
Berkshire, VT
4 FAS 0302, FAS 0307 + Town Rd. 0004
Total Crashes: 3.6
Fatal Crashes: 0.6
Injury Crashes: 3.6
Crashes with Property Damage Only: 0.6
Source: VT DOT
 View Larger +
Prev
Next
#35
Williston, VT
67 US-2 + Industrial Ave.
Total Crashes: 20.4
Fatal Crashes: 0.6
Injury Crashes: 3
Crashes with Property Damage Only: 18
Photo: Flickr/Craig O'Neal
Source: VT DOT
 View Larger +
Prev
Next
#34
Augusta, ME
Memorial Circle + Western Ave.
Total Crashes: 107
Fatal Crashes: 0
Injury Crashes: 19
Crashes with Property Damage Only: 88
Source: ME DOT
 View Larger +
Prev
Next
#33
Burlington, VT
35 Main St. + St. Paul St.
Total Crashes: 18
Fatal Crashes: 0.6
Injury Crashes: 4.8
Crashes with Property Damage Only: 13.2
Source: VT DOT
 View Larger +
Prev
Next
#32
Hartford, VT
7 US-5 + VT-14, US-4
Total Crashes: 31.8
Fatal Crashes: 0.6
Injury Crashes: 3.6
Crashes with Property Damage Only: 28.2
Source: VT DOT
 View Larger +
Prev
Next
#31
Burlington, VT
5 Colchester Ave. + Barrett St.
Total Crashes: 20.4
Fatal Crashes: 0.6
Injury Crashes: 5.4
Crashes with Property Damage Only: 15
Source: VT DOT
 View Larger +
Prev
Next
#30
Augusta, ME
Bangor St. + Cony Circle, Cony St.
Total Crashes: 126
Fatal Crashes: 0
Injury Crashes: 19
Crashes with Property Damage Only: 106
Photo: Flickr/Peter Gene
Source: ME DOT
 View Larger +
Prev
Next
#29
Winooski City, VT
2 US-7, E. Canal St. + W. Allen St., VT-15, W. Center St.
Total Crashes: 103.2
Fatal Crashes: 0
Injury Crashes: 22.8
Crashes with Property Damage Only: 86.4
Source: VT DOT
 View Larger +
Prev
Next
#28
Augusta, ME
Ramp off to Western Ave. + Western Ave.
Total Crashes: 99
Fatal Crashes: 0
Injury Crashes: 26
Crashes with Property Damage Only: 73
Source: ME DOT
 View Larger +
Prev
Next
#27
Lowell, MA
Bridge St. + Veterans of Foreign Wars Highway
Total Crashes: 112
Fatal Crashes: 0
Injury Crashes: 34
Crashes with Property Damage Only: 78
Photo: Flickr/Peter Gene
Source: MA DOT
 View Larger +
Prev
Next
#26
Hartford, CT
Rt. 44 Mile Marker 53.63 (Route 44 & Main St)
Total Crashes: 129
Fatal Crashes: 0
Injury Crashes: 38
Crashes with Property Damage Only: 91
Source: CT DOT
 View Larger +
Prev
Next
#25
Holyoke, MA
Holyoke St. + Holyoke Mall at Ingleside
Total Crashes: 198
Fatal Crashes: 0
Injury Crashes: 29
Crashes with Property Damage Only: 169
Source: MA DOT
 View Larger +
Prev
Next
#24
Lowell, MA
Veterans of Foreign Wars Highway + Varnum Ave.
Total Crashes: 165
Fatal Crashes: 0
Injury Crashes: 37
Crashes with Property Damage Only: 128
Source: MA DOT
 View Larger +
Prev
Next
#23
Lewiston, ME
Old Greene Rd. + Randall Rd., Sabattus St.
Total Crashes: 33
Fatal Crashes: 1
Injury Crashes: 9
Crashes with Property Damage Only: 23
Photo: Flickr/Perthhdproductions
Source: ME DOT
 View Larger +
Prev
Next
#22
Bangor, ME
Broadway, Hobart St. + Broadway, Burleigh Rd., Griffin Rd.
Total Crashes: 33
Fatal Crashes: 1
Injury Crashes: 13
Crashes with Property Damage Only: 19
Photo: Flickr/Ajimaxx
Source: ME DOT
 View Larger +
Prev
Next
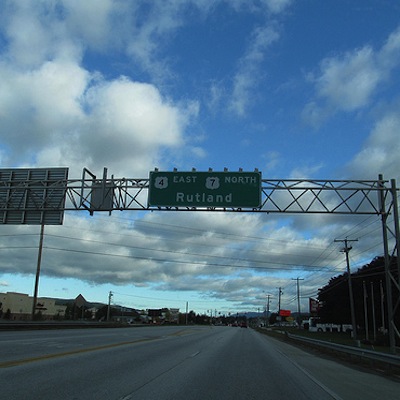
#21
Rutland City, VT
47 US-7 + US-4
Total Crashes: 40.2
Fatal Crashes: 1.2
Injury Crashes: 6
Crashes with Property Damage Only: 35.4
Photo: Flickr/Doug Kerr
Source: VT DOT
 View Larger +
Prev
Next
#20
Cambridge, MA
Massachusetts Ave. + Vassar St.
Total Crashes: 41
Fatal Crashes: 1
Injury Crashes: 19
Crashes with Property Damage Only: 21
Photo: Flickr/The_th
Source: MA DOT
 View Larger +
Prev
Next
#19
Worcester, MA
Main St. + Mill St.
Total Crashes: 53
Fatal Crashes: 1
Injury Crashes: 18
Crashes with Property Damage Only: 34
Photo: Flickr/jburwen
Source: MA DOT
 View Larger +
Prev
Next
#18
Holyoke, MA
Main St. + Cabot St.
Total Crashes: 57
Fatal Crashes: 1
Injury Crashes: 18
Crashes with Property Damage Only: 38
Photo: Flickr/Nanypinya
Source: MA DOT
 View Larger +
Prev
Next
#17
Waltham, MA
Main St. + Lyman St.
Total Crashes: 73
Fatal Crashes: 1
Injury Crashes: 18
Crashes with Property Damage Only: 54
Source: MA DOT
 View Larger +
Prev
Next
#16
Bridgton, ME
Portland Rd., Willis Park Rd. + Portland Rd., Sandy Creek Rd.
Total Crashes: 20
Fatal Crashes: 2
Injury Crashes: 6
Crashes with Property Damage Only: 12
Photo: Flickr/gillicious
Source: ME DOT
 View Larger +
Prev
Next
#15
Lincoln, RI
Interstate 295 + Exit 9 (RI 146)
Total Crashes: 160
Fatal Crashes: 1
Injury Crashes: 36
Crashes with Property Damage Only: 123
Photo: Flickr/Doug Kerr
Source: RI DOT
 View Larger +
Prev
Next
#14
Stoughton, MA
Canton St. + School St.
Total Crashes: 39
Fatal Crashes: 2
Injury Crashes: 10
Crashes with Property Damage Only: 27
Photo: Flickr/Peter Gene
Source: MA DOT
 View Larger +
Prev
Next
#13
Chelsea, MA
Revere Beach Pkwy. + Washington Ave.
Total Crashes: 39
Fatal Crashes: 2
Injury Crashes: 11
Crashes with Property Damage Only: 26
Photo: Flickr/Bettyx1138
Source: MA DOT
 View Larger +
Prev
Next
#12
Warwick, RI
RI 37 + US 1 (Post Rd.)
Total Crashes: 293
Fatal Crashes: 0
Injury Crashes: 69
Crashes with Property Damage Only: 224
Photo: Flickr/eliduke
Source: RI DOT
 View Larger +
Prev
Next
#11
North Smithfield, RI
RI 146 + Sayles Hill Rd.
Total Crashes: 193
Fatal Crashes: 1
Injury Crashes: 37
Crashes with Property Damage Only: 155
Source: RI DOT
 View Larger +
Prev
Next
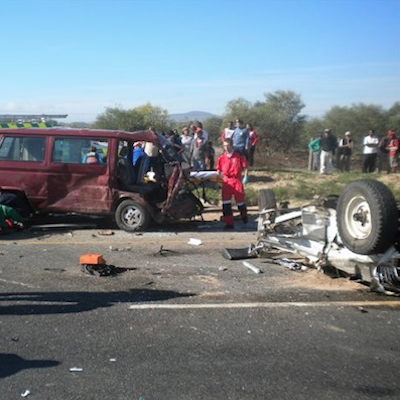
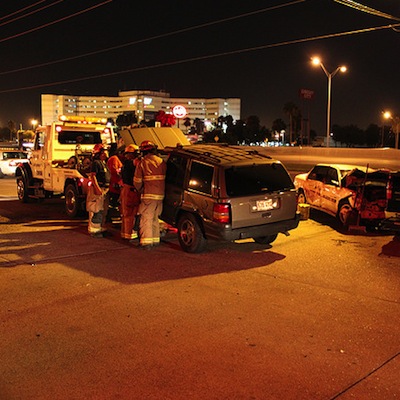
#10
Warwick, RI
Interstate 95 + Exit 14 (RI 37)/Exit 15 (Jefferson Blvd.)
Total Crashes: 181
Fatal Crashes: 1
Injury Crashes: 50
Crashes with Property Damage Only: 130
Photo: Flickr/ER24 EMS (Pty) Ltd.
Source: RI DOT
 View Larger +
Prev
Next
#9
Johnston, RI
Interstate 295 + Exit 6 (US 6/US 6A)
Total Crashes: 179
Fatal Crashes: 1
Injury Crashes: 54
Crashes with Property Damage Only: 124
Photo: Flickr/Doug Kerr
Source: RI DOT
 View Larger +
Prev
Next
#8
Cranston, RI
RI 2 Reservoir Ave. + RI 12 (Park Ave.)
Total Crashes: 234
Fatal Crashes: 1
Injury Crashes: 47
Crashes with Property Damage Only: 186
Source: RI DOT
 View Larger +
Prev
Next
#7
Hopkinton, RI
RI 138 (Spring St.) + Wincheck Pond Rd. to Soap House Ln.
Total Crashes: 4
Fatal Crashes: 3
Injury Crashes: 0
Crashes with Property Damage Only: 1
Source: RI DOT
 View Larger +
Prev
Next
#6
Middletown, CT
Rt. 17 MM 21.55-22.14
Total Crashes: 372
Fatal Crashes: 0
Injury Crashes: 107
Crashes with Property Damage Only: 265
Source: CT DOT
 View Larger +
Prev
Next
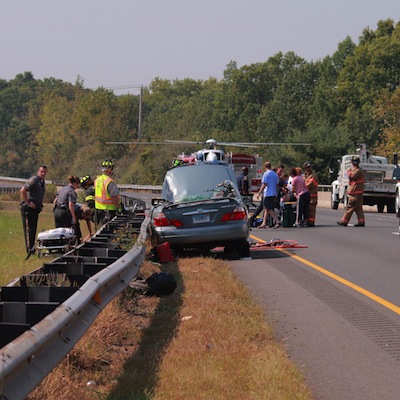
#5
Charlestown, RI
US Post Rd. SB + Kings Factory Rd. to RI 216 (Ross Hill Rd.)
Total Crashes: 51
Fatal Crashes: 3
Injury Crashes: 8
Crashes with Property Damage Only: 40
Source: RI DOT
 View Larger +
Prev
Next
#4
Providence, RI
Interstate 95 + Exit 18 (Thurbers Ave.)
Total Crashes: 296
Fatal Crashes: 1
Injury Crashes: 79
Crashes with Property Damage Only: 216
Source: RI DOT
 View Larger +
Prev
Next
#3
Somerville, MA
Mystic Ave. + Fellsway
Total Crashes: 91
Fatal Crashes: 3
Injury Crashes: 24
Crashes with Property Damage Only: 64
Source: MA DOT
 View Larger +
Prev
Next
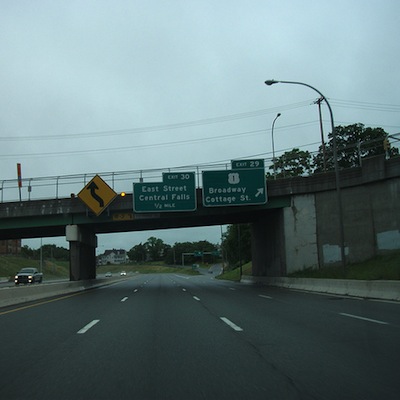
#2
Pawtucket, RI
Interstate 95 + Exit 29 (US 1/Broadway/Cottage St.)
Total Crashes: 191
Fatal Crashes: 2
Injury Crashes: 55
Crashes with Property Damage Only: 134
Source: RI DOT
 View Larger +
Prev
Next
#1
New Haven, CT
Merritt Parkway Mile Marker 46.42-47.03
Total Crashes: 561
Fatal Crashes: 0
Injury Crashes: 125
Crashes with Property Damage Only: 436
Source: CT DOT
Related Articles
Enjoy this post? Share it with others.


_400_400_90.jpeg)


_80_80_90_c1.jpeg)


