
Kilmartin, Providence Community Groups Spar Over Google Money
Saturday, August 09, 2014
Community leaders are expressing "deep disappointment" following a response from Rhode Island Attorney General Peter Kilmartin regarding their request for youth development and re-entry programming funding from the state's 2011 Google settlement money.

Groups including the NAACP Providence Branch and OIC of Rhode Island had reached out to Kilmartin to request for the 15% set aside of the Attorney General's $60 million that was part the settlement won by Rhode Island Attorney General Peter Nehrona in 2012 following his successful prosecution of Google for advertising illegal prescription drugs online.
GET THE LATEST BREAKING NEWS HERE -- SIGN UP FOR GOLOCAL FREE DAILY EBLAST"I am extremely disappointed," said Jim Vincent with the NAACP. "The letter is incredibly unclear -- it gave no clear understanding of the process. OK, so there's only $25,000 now available for community programming. If there's $10,000, or $2,000 left, that's fine. But we don't know."
"We understand there are restrictions from the [Department of Justice]," said Vincent. "But [Kilmartin] goes on to say he's looking out for the taxpayers. Am I not a taxpayer? It seems like he's reluctant to try and help our community in ways we feel are meaningful. He's forgotten who he's working for."
Google Money Changes
On July 11, the NAACP Providence Branch, in collaboration with concerned neighborhood organizations, issued a "call to action" as the result of the continual acts of violence in the community, saying at the time, "There is a need to engage the entire community to work toward a collective resolution." Among its five point plan, the groups requested the Attorney General dedicate 15% of the Google settlement funding to support youth development and ex-offender training and employment programming.
On August 5, Kilmartin issued a release stating that the United States Department of Justice announced on July 30 that several policy changes had been implemented regarding Google settlement funds, including one affecting “Community-based Programs.” According to the guidance, “the amount of equitable sharing funds used to support community-based programs …may use up to a total of $25,000 annually to support such programs…” Formerly, the formula for community-based program expenditures was based upon 15 percent of the funds received."
In his response to Vincent, Kilmartin wrote, "In effect, you request is totally inconsistent with federal guidelines and therefor has to be respectfully denied before it is even considered."
Michael Van Leesten with OIC of Rhode Island, who said he had a sent a letter as well to Kilmartin, but did not get a response back, said he found the tone of the letter "dismissive."
"I'm disappointed in the dismissive tone of this letter," said Van Leesten. "The commentary was suspicious of the NAACP and the letter from the OIC. There's nothing we're trying to conspire to do anything otherwise. We share the same goals. We were looking for collaboration, not confrontation or strict interpretation, and how best we as a community can work together to make a change and make a difference."
"It's the first time in my recollection that had such a defensive response from an elected office. I'm not looking to be political, it's just the reality," said Van Leesten.
Looking Ahead
State Senator and Republican candidate for Attorney General Dawson Hodgson said be believed there were still avenues for community funding.

"The AG can still seek a waiver to depart from DOJ guidelines. That's how local police departments were able to allocate Google settlement funds to replenish unfunded police pensions, a use which is not normally permitted by the guidelines," said Hodgson. "My questions for the AG would be, will your office now request waivers to facilitate this type of community investment? Why hasn't the office released any framework to put these resources to work?"
Community organizer Kobi Dennis, however, said he was "simply appalled" at the response.
"As an elected official he has shown complete arrogance and disregard towards a simple request to meet with community stakeholders. The audacity of he to speak in such a manner referring to his responsibility to the "tax payers" of RI as if we were not, is inexcusable. My job as a community activist / liaison is much more challenging when we relay to the "tax payers" this type of response for a simple request for a meeting to discuss allocated funds from an elected official whom I held in high regard," said Dennis. "The NAACP is a fair representation of "the people" that could benefit from increased educational / re-entry programs, prevention / employment programs. This was the crux of our entire request to meet. As a RI TAX PAYER and Citizen I feel disrespected and unappreciated. The people will decide."
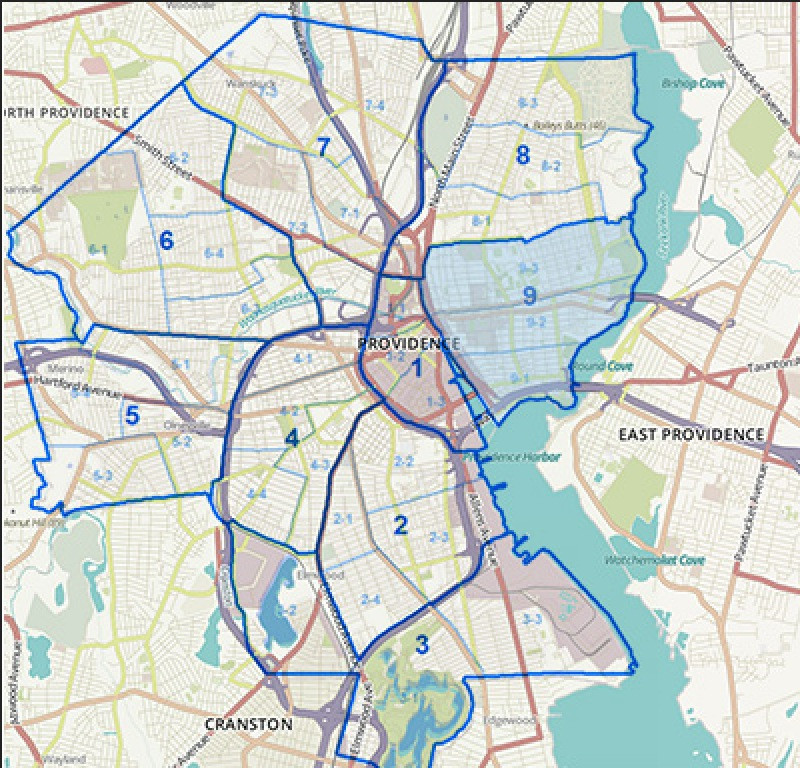
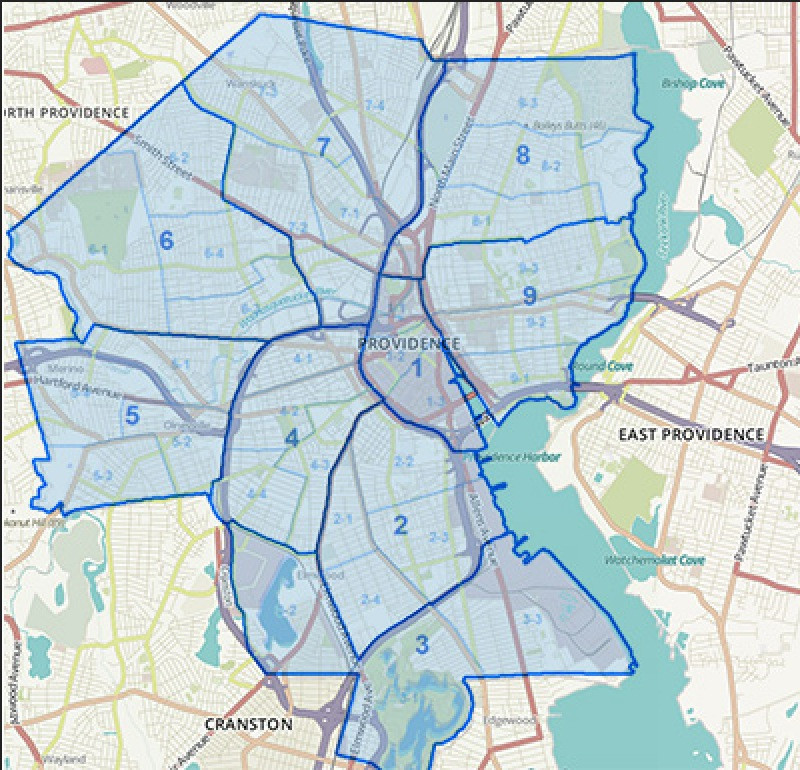
Related Slideshow: Providence’s Most Violent Neighborhoods
Each week, the Providence Police Department releases its "Weekly Crime Comparison Report" on its website. The breakdown covers how many crimes have occured in the past week, past month, and year to date in each Police District and comparing them with the same time interval from the year prior, reflecting changes in crime rates. GoLocal has distilled the key data points from this weeks report to reflect YTD crime data grouped by general category- violent, property, other, and total. For the full report as filed by the PPD, click here.


Related Articles
- NEW: Candidate for AG Hodgson Proposes Action Plan for Google Fund
- NEW: Hodgson Announces Candidacy for Attorney General
- NEW: Hodgson Wants To Slow Down Transition to State Board of Education
- NEW: Hodgson Calls for Action from AG on Overdose Epidemic
- NEW: Hodgson Calls for RI to Use RICO Law to Combat Gang Violence
- Hodgson Stands with NAACP on Reducing Violence
- NEW: AG Kilmartin Warns RI Football Fans of Possible Ticket Scams
- NEW: Kilmartin and Verizon Wireless Team-up to Benefit Victims of Domestic Violence
- NEW: Kilmartin slams ACLU for “one-sided” view of APRA enforcement
- Palumbo, Kilmartin Renew Call for Better Tracking of Sex Offenders
- NEW: Kilmartin Joins $7 Million Settlement Over Google Street View
- NEW: Kilmartin Applauds Congress for Extending Mortgage Debt Relief
- NEW: Kilmartin’s “Open Government Summit” to be Streamed Live
- CONSUMER ALERT: Yahoo Notifies AG Kilmartin of Security Breach
- NEW: Kilmartin to Represent National AG Association in Moscow
- NEW: AG Kilmartin Warns of Jury Duty and Arrest Warrant Scam in RI
- AG Kilmartin Warns Consumers to Read Fine Print on Gym Memberships
- AG Kilmartin Announces a $40.1 Million Settlement with CareFusion
- Hodgson Refuses to Call Out Kilmartin on RI Beach Contract Controversy
- NEW: Kilmartin Announces $600 Million Settlement with Amgen
- NEW: AG Kilmartin—Mortgage Settlement Checks Mailing This Month
- Richard August: Kilmartin Speaks On Guns
- Kilmartin to Host Shred-a-Thons For Nat. Consumer Protection Week
- RI AG Kilmartin Spent, Fundraised Thousands in Florida
- NEW: Kilmartin Urges More Pharmacies to Stop Selling Tobacco in RI
- NEW: AG Candidate Hodgson Calls for Kilmartin, Kempe to Step Aside
- Kilmartin Responds to Hodgson on RICO Gang Initiative
- Kilmartin Could Be Vulnerable to Hodgson in RI AG’s Race
- NEW: Kilmartin Calls on Congress to Extend Tax Relief for Distressed Homeowners
- NEW:: Kilmartin Says State Will Receive Over $647k from Pfizer Lawsuit
- NEW: Kilmartin Joins Multi-State Coalition in Action to Curb Climate Change Pollution
