INTERACTIVE: Where RI Household Incomes Have Risen the Most
Wednesday, August 19, 2015
GoLocalProv and FindTheBest
Here Are the Counties Where Household Income Has Risen the Most in Rhode Island American households are making more money today than they did three decades ago—in some places, a lot more. In order to find out which places have seen the greatest increase in household income, we turned to the
National Historical Geographic Information System (NHGIS), which uses historical reports from the decennial Census and the American Community Survey to track median income over time.
Research site MooseRoots then adjusted all the data to 2015 dollars to filter out the effects of inflation. On the whole, households in northeastern states have seen the largest income increase since 1980, with New Hampshire, Massachusetts and Vermont ranking among the top five. South Dakota and the District of Columbia round out the top list. In each case, household income has risen over 30% in just 30 years. Only a handful of states have seen median household incomes actually decrease since 1980—and several of them are in the Midwest. For a big-picture perspective on the changes across the nation, Mooseroots created heat maps to show the 30-year transformation, both in absolute dollars and percent change. You can use the toggle menu below to adjust the metric.
On the extreme ends, Massachusetts household income rose over $18,000 in three decades, while household income in Michigan dropped by about $5,000. Meanwhile, the median increase across the whole nation was $6,280. Unfortunately, this picture of economic prosperity gets a lot less rosy the more you look at extra caveats and context. The American household as a whole might be making more now, but young Americans are making less. The rise of technology and automation has eliminated the need for many blue-collar jobs, the sort of positions once filled by non-college-educated young workers. While this change has impacted Michigan the most, the trend holds true across the nation. Next, consider that the cost of living has risen most rapidly in coastal states like California and New York. With the notable exception of South Dakota, the rise in median income has struggled to match the rise of home prices, college tuition and other life expenses, effectively canceling out the gains. So while households today earn more money, they tend to have higher expenses as well. Here are the 5 counties in Rhode Island where median household income has increased the most since 1980. 5. Newport County - Median income change: $23,460 (48.8%).
4. Washington County - Median income change: $22,499 (43.5%).
GET THE LATEST BREAKING NEWS HERE -- SIGN UP FOR GOLOCAL FREE DAILY EBLAST
3. Bristol County - Median income change: $19,857 (37.5%).
2. Kent County - Median income change: $10,729 (20.4%).
1. Providence County - Median income change: $8,082 (19.1%).
Here are the 5 counties in Rhode Island where median household income has increased the most since 1980. 5. Providence County - Median income change: $8,082 (19.1%).
4. Kent County - Median income change: $10,729 (20.4%).
3. Bristol County - Median income change: $19,857 (37.5%).
2. Washington County - Median income change: $22,499 (43.5%).
1. Newport County - Median income change: $23,460 (48.8%).
Related Slideshow: The Wealth Gap in RI Cities and Towns
The below slides list the most financially unequal cities and towns in Rhode Island, in order of least to most unequal. For each community, the percent of residents at the very bottom and the very top of the income scale are listed. In addition, the median income, which is the amount made by those in the middle, and the percent of those at the median are also provided for each community. The degree of inequality is measured by comparing the combined percent of those at the top and bottom with the percent of those in the middle. If the total percent of those at the top and bottom exceeds that for the middle, the community is has greater financial inequality than the one where most income earners are in the middle. Scores above 1 indicate greater financial inequality. Scores below 1 indicate less.
 View Larger +
Prev
Next
39.
Hopkinton
Percent earning under $14,999: 5.0%
Percent earning over $150,000: 9.4%
Median income: $67,022
% in Median bracket: 23.6%
Inequality Score: 0.00
Score Key: Figures above 1 correspond to more inequality. Scores under 1 mean communities are more equal.
 View Larger +
Prev
Next
38.
Charlestown
Percent earning under $14,999: 6.0%
Percent earning over $150,000: 9.8%
Median income: $69,349
% in Median bracket:19.5%
Inequality Score: 0.81
Score Key: Figures above 1 correspond to more inequality. Scores under 1 mean communities are more equal.
 View Larger +
Prev
Next
37.
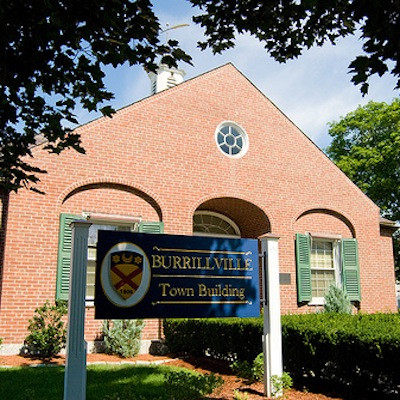
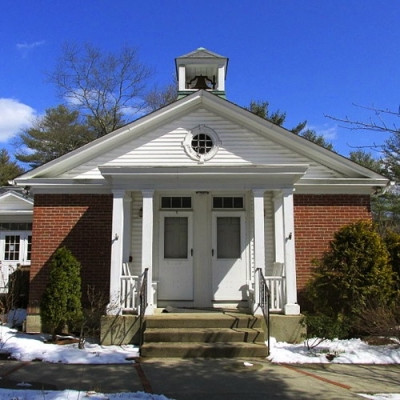
Burrillville
Percent earning under $14,999: 8.1%
Percent earning over $150,000: 9.6%
Median income: $62,188
% in Median bracket: 20.7%
Inequality Score: 0.86
Score Key: Figures above 1 correspond to more inequality. Scores under 1 mean communities are more equal.
 View Larger +
Prev
Next
36.
Warwick
Percent earning under $14,999: 9.5%
Percent earning over $150,000: 9.1%
Median income: $62,295
% in Median bracket: 21.2%
Inequality Score: 0.88
Score Key: Figures above 1 correspond to more inequality. Scores under 1 mean communities are more equal.
 View Larger +
Prev
Next
35.
Coventry
Percent earning under $14,999: 9.0%
Percent earning over: $150,000: 9.2%
Median income: $65,565
% in Median bracket: 20.1%
Inequality Score: 0.91
Score Key: Figures above 1 correspond to more inequality. Scores under 1 mean communities are more equal.
 View Larger +
Prev
Next
34.
Foster
Percent earning under $14,999: 4.2%
Percent earning over $150,000:17.4%
Median income: $81,651
% in Median bracket: 23.5%
Inequality Score: 0.92
Score Key: Figures above 1 correspond to more inequality. Scores under 1 mean communities are more equal.
 View Larger +
Prev
Next
33.
Glocester
Percent earning under $14,999: 4.8%
Percent earning over $150,000: 11.6%
Median income: $80,942
% in Median bracket: 17.7%
Inequality Score: 0.93
Score Key: Figures above 1 correspond to more inequality. Scores under 1 mean communities are more equal.
 View Larger +
Prev
Next
32.
North Providence
Percent earning under $14,999: 13.1%
Percent earning over $150,000: 5.8%
Median income: $51,470
% in Median bracket: 19.6%
Inequality Score: 0.96
Score Key: Figures above 1 correspond to more inequality. Scores under 1 mean communities are more equal.
 View Larger +
Prev
Next
31.
Westerly
Percent earning under $14,999: 7.9%
Percent earning over $150,000: 11.5%
Median income: $60,532
% in Median bracket:18.5%
Inequality Score: 1.05
Score Key: Figures above 1 correspond to more inequality. Scores under 1 mean communities are more equal.
 View Larger +
Prev
Next
30.
New Shoreham
Percent earning under $14,999: 3.8 %
Percent earning over $150,000: 20.7%
Median income: $90,491
% in Median bracket: 23.0%
Inequality Score: 1.07
Score Key: Figures above 1 correspond to more inequality. Scores under 1 mean communities are more equal.
 View Larger +
Prev
Next
29.
Warren
Percent earning under $14,999: 11.3%
Percent earning over $150,000: 9.3%
Median income: $54,295
% in Median bracket: 18.8%
Inequality Score: 1.10
Score Key: Figures above 1 correspond to more inequality. Scores under 1 mean communities are more equal.
 View Larger +
Prev
Next
28.
Smithfield
Percent earning under $14,999: 5.2%
Percent earnng over $150,000: 16.0%
Median income: $74,000
% in Median bracket: 19.3%
Inequality Score: 1.10
Score Key: Figures above 1 correspond to more inequality. Scores under 1 mean communities are more equal.
 View Larger +
Prev
Next
27.
West Greenwich
Percent earning under $14,999: 2.9%
Percent earning over $150,000: 17.1%
Median income: $78,438
% in Median bracket: 18.1%
Inequality Score: 1.10
Score Key: Figures above 1 correspond to more inequality. Scores under 1 mean communities are more equal.
 View Larger +
Prev
Next
26.
Richmond
Percent earning under $14,999: 4.5%
Percent earning over $150,000: 20.2%
Median income: $93,975
% in Median bracket: 22.2%
Inequality Score: 1.11
Score Key: Figures above 1 correspond to more inequality. Scores under 1 mean communities are more equal.
 View Larger +
Prev
Next
25.
West Warwick
Percent earning under $14,999: 14.5%
Percent earning over $150,000: 4.4%
Median income: $50,590
% in Median bracket: 16.4%
Inequality Score: 1.15
Score Key: Figures above 1 correspond to more inequality. Scores under 1 mean communities are more equal.
 View Larger +
Prev
Next
24.
Middletown
Percent earning under $14,999: 9.2%
Percent earning over $150,000: 13.8%
Median income: $69,784
% in Median bracket: 19.3%
Inequality Score: 1.19
Score Key: Figures above 1 correspond to more inequality. Scores under 1 mean communities are more equal.
 View Larger +
Prev
Next
23.
Cranston
Percent earning under $14,999: 10.8%
Percent earning over $150,000: 9.6%
Median income: $60,283
% in Median bracket: 17.1%
Inequality Score: 1.19
Score Key: Figures above 1 correspond to more inequality. Scores under 1 mean communities are more equal.
 View Larger +
Prev
Next
22.
Tiverton
Percent earning under $14,999: 7.7%
Percent earning over $150,000: 11.6%
Median income: $73,085
% in Median bracket: 15.6%
Inequality Score: 1.24
Score Key: Figures above 1 correspond to more inequality. Scores under 1 mean communities are more equal.
 View Larger +
Prev
Next
21.
North Smithfield
Percent earning under $14,999: 5.7%
Percent earning over $150,000: 15.3%
Median income: $77,378
% in Median bracket: 16.4%
Inequality Score: 1.28
Score Key: Figures above 1 correspond to more inequality. Scores under 1 mean communities are more equal.
 View Larger +
Prev
Next
20.
Cumberland
Percent earning under $14,999: 8.2%
Percent earning over $150,000: 14.5%
Median income: $72,160
% in Median bracket: 17.3%
Inequality Score: 1.31
Score Key: Figures above 1 correspond to more inequality. Scores under 1 mean communities are more equal.
 View Larger +
Prev
Next
19.
Scituate
Percent earning under $14,999: 5.7%
Percent earnng over $150,000: 16.7%
Median income: $78,980
% in Median bracket: 16.7%
Inequality Score: 1.34
Score Key: Figures above 1 correspond to more inequality. Scores under 1 mean communities are more equal.
 View Larger +
Prev
Next
18.
East Providence
Percent earning under $14,999: 13.2%
Percent earning over $150,000: 6.3%
Median income: $48,521
% in Median bracket: 14.2%
Inequality Score: 1.37
Score Key: Figures above 1 correspond to more inequality. Scores under 1 mean communities are more equal.
 View Larger +
Prev
Next
17.
Johnston
Percent earning under $14,999: 14.9%
Percent earning over $150,000: 8.6%
Median income: $56,343
% in Median bracket: 16.8%
Inequality Score: 1.40
Score Key: Figures above 1 correspond to more inequality. Scores under 1 mean communities are more equal.
 View Larger +
Prev
Next
16.
Newport
Percent earning under $14,999: 9.1%
Percent earning over $150,000: 15.2%
Median income: $71,713
% in Median bracket: 17.3%
Inequality Score: 1.40
Score Key: Figures above 1 correspond to more inequality. Scores under 1 mean communities are more equal.
 View Larger +
Prev
Next
15.
South Kingstown
Percent earning under $14,999: 5.8%
Percent earning over $150,000: 18.9%
Median income: $73,780
% in Median bracket: 17.4%
Inequaltiy Score: 1.42
Score Key: Figures above 1 correspond to more inequality. Scores under 1 mean communities are more equal.
 View Larger +
Prev
Next
14.
Barrington
Percent earning under $14,999: 2.7%
Percent earning over $150,000: 30.1%
Median income: $103,696
% in Median bracket: 21.8%
Inequality Score: 1.50
Score Key: Figures above 1 correspond to more inequality. Scores under 1 mean communities are more equal.
 View Larger +
Prev
Next
13.
Bristol
Percent earning under $14,999: 13.9%
Percent earning over $150,000: 11.9%
Median income: $62,358
% in Median bracket: 16.6%
Inequality Score: 1.55
Score Key: Figures above 1 correspond to more inequality. Scores under 1 mean communities are more equal.
 View Larger +
Prev
Next
12.
Narragansett
Percent earning under $14,999: 9.3%
Percent earning over $150,000: 17.2%
Median income: $66,600
% in Median bracket: 16.9%
Inequality Score: 1.57
Score Key: Figures above 1 correspond to more inequality. Scores under 1 mean communities are more equal.
 View Larger +
Prev
Next
11.
Exeter
Percent earning under $14,999: 6.8%
Percent earning over $150,000: 16.3%
Median income: $81,591
% in Median bracket: 14.6%
Inequality Score: 1.58
Score Key: Figures above 1 correspond to more inequality. Scores under 1 mean communities are more equal.
 View Larger +
Prev
Next
10.
Pawtucket
Percent earning under $14,999: 20.1%
Percent earning over $150,000: 3.7%
Median income: $40,379
% in Median bracket: 14.6%
Inequality Score: 1.63
Score Key: Figures above 1 correspond to more inequality. Scores under 1 mean communities are more equal.
 View Larger +
Prev
Next
9.
Lincoln
Percent earning under $14,999: 7.2%
Percent earning over $150,000: 18.1%
Median income: $72,434
% in Median bracket: 15.4%
Inequality Score: 1.64
Score Key: Figures above 1 correspond to more inequality. Scores under 1 mean communities are more equal.
 View Larger +
Prev
Next
8.
Portsmouth
Percent earning under $14,999: 8.6%
Percent earning over $150,000: 21.8%
Median income: $74,487
% in Median bracket: 17.9%
Inequality Score: 1.70
Score Key: Figures above 1 correspond to more inequality. Scores under 1 mean communities are more equal.
 View Larger +
Prev
Next
7.
Central Falls
Percent earning under $14,999: 23.2%
Percent earning over $150,000: 0.9%
Median income: $27,993
% in Median bracket: 13.7%
Inequality Score: 1.76
Score Key: Figures above 1 correspond to more inequality. Scores under 1 mean communities are more equal.
 View Larger +
Prev
Next
6.
North Kingstown
Percent earning under $14,999: 6.7%
Percent earning over $150,000: 20.2%
Median income: $80,530
% in Median bracket: 14.3%
Inequality Score: 1.88
Score Key: Figures above 1 correspond to more inequality. Scores under 1 mean communities are more equal.
 View Larger +
Prev
Next
5.
Woonsocket
Percent earning under $14,999: 23.6%
Percent earning over $150,000: 3.2%
Median income: $36,058
% in Median income: 13.2%
Inequality Score: 2.03
Score Key: Figures above 1 correspond to more inequality. Scores under 1 mean communities are more equal.
 View Larger +
Prev
Next
4.
Little Compton
Percent earning under $14,999: 7.2%
Percent earning over $150,000: 21.7%
Median income: $85,852
% in Median income: 13.0%
Inequality Score: 2.22
Score Key: Figures above 1 correspond to more inequality. Scores under 1 mean communities are more equal.
 View Larger +
Prev
Next
3.
Providence
Percent earning under $14,999: 24.6%
Percent earning over $150,000: 6.8%
Median income: $37,632
% in Median income: 12.7%
Inequality Score: 2.47
Score Key: Figures above 1 correspond to more inequality. Scores under 1 mean communities are more equal.
 View Larger +
Prev
Next
2.
Jamestown
Percent earning under $14,999: 8.6%
Percent earning over $150,000: 25.3%
Median income: $90,484
% in Median income: 13.2%
Inequality Score: 2.57
Score Key: Figures above 1 correspond to more inequality. Scores under 1 mean communities are more equal.
 View Larger +
Prev
Next
1.
East Greenwich
Percent earning under $14,999: 5.9%
Percent earning over $150,000: 33.1%
Median income: $96,438
% in Median income: 11.2%
Inequality Score: 3.48
Score Key: Figures above 1 correspond to more inequality. Scores under 1 mean communities are more equal.
Related Articles
Enjoy this post? Share it with others.