slides: Hurricanes and Other Disasters: The RI Communities at Greatest Risk
Monday, December 09, 2013
Stephen Beale, GoLocalProv News Contributor
What communities are facing the biggest threat of a natural disaster? The below slides provided a detailed breakdown of the risk and vulnerability for each city and town. Find out where your community stands.
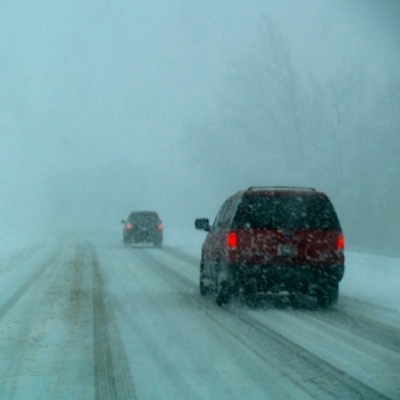
Photo credit: Melissa Devine, 2012
Related Slideshow: Natural Disasters: RI’s Most At Risk and Vulnerable Communities
The below slides show what communities are at greatest risk and most vulnerable to a particular natural disaster, such as another hurricane, or a less-common disaster, such as an earthquake or a tornado. Higher scores correspond to a higher risk and vulnerability for that community. Cities and towns are listed starting with those that have the least risk and vulnerability, ending with the most at-risk and most vulnerable. Because flooding is a particular concern to Rhode Islanders, additional information on the threat of flooding from a major 100-year storm is shown.
Scoring method
The score for each type of hazard was determined by multiplying two separate scores together: the hazard risk score and the vulnerability score. The hazard risk score was calculated by multiplying three scores together: the score for frequency (how often something happens), the score for area impact (area that would be affected), and the score for intensity (such as the depth of a flood or the wind speed of a three-second gust in a hurricane). Higher scores mean a higher risk. The vulnerability score was derived using a similar multi-layered calculation that takes into account the population size and characteristics (for example, elderly and low-income populations are more vulnerable), the economy, the environment, and the number and importance of critical facilities like hospitals or power stations. Higher scores mean a greater vulnerability.
The scores are not against any scale. Instead they are relative in nature, showing how risk and vulnerability for a natural disaster is distributed throughout the state. A community with a higher score has a greater share of risk and vulnerability than one with a lower score. Scores and method information are from 2011 State Hazard Mitigation Plan. (A 2014 updated plan has been recently released, but numerical scores are not provided for each community.) For a detailed description of the entire scoring method, see PDF pages 123 to 145 on the 2011 plan.
 View Larger +
Prev
Next
#39 Little Compton
Natural Hazard Scores
Wind Score: 160
Flood Score: 18
Earthquake Score: 60
Tornado Score: 16
Snow Score: 50
Total Score: 424
Flood Damage
Rank: 14
Acres at Risk of Flooding: 2,516
Percent of Total Acres in Community at Risk: 16.78%
Hurricane Coastal Flooding
Number of Residents in Evac. Zone: 1,160
Number of Buildings at Risk: 187
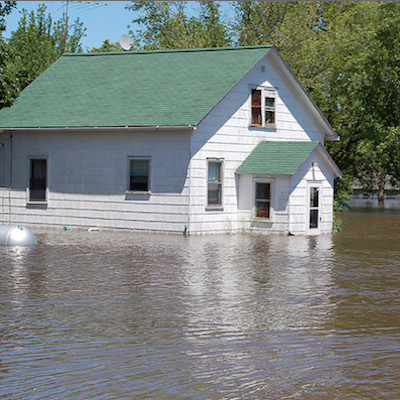
Photo: Flickr/Al Carmadella Jr.
 View Larger +
Prev
Next
#38 Richmond
Natural Hazard Scores
Wind Score: 200
Flood Score: 18
Earthquake Score: 90
Tornado Score: 24
Snow Score: 75
Total Score: 587
Flood Damage
Rank: 24
Acres at Risk of Flooding: 2,945
Percent of Total Acres in Community at Risk: 11.35%
Hurricane Coastal Flooding
Number of Residents in Evac. Zone: N/A
Number of Buildings at Risk: N/A
 View Larger +
Prev
Next
#37 Exeter
Natural Hazard Scores
Wind Score: 240
Flood Score: 0
Earthquake Score: 90
Tornado Score: 24
Snow Score: 75
Total Score: 609
Flood Damage
Rank: 36
Acres at Risk of Flooding: 2,190
Percent of Total Acres in Community at Risk: 5.78%
Hurricane Coastal Flooding
Number of Residents in Evac. Zone: N/A
Number of Buildings at Risk: N/A
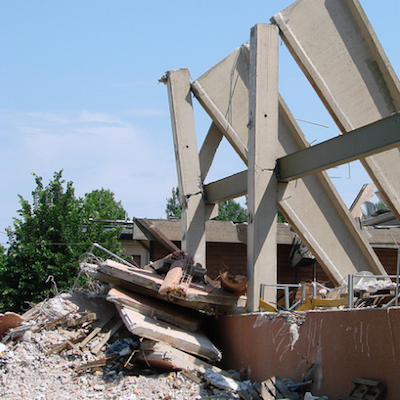
Photo: Flickr/UCL Mathematical
 View Larger +
Prev
Next
#36 West Greenwich
Natural Hazard Scores
Wind Score: 240
Flood Score: 0
Earthquake Score: 90
Tornado Score: 24
Snow Score: 75
Total Score: 609
Flood Damage
Rank: 39
Acres at Risk of Flooding: 1,197
Percent of Total Acres in Community at Risk: 3.62%
Hurricane Coastal Flooding
Number of Residents in Evac. Zone: N/A
Number of Buildings at Risk: N/A
Photo: Flickr/born1945
 View Larger +
Prev
Next
#35 New Shoreham
Natural Hazard Scores
Wind Score: 300
Flood Score: 27
Earthquake Score: 90
Tornado Score: 24
Snow Score: 75
Total Score: 696
Flood Damage
Rank: 13
Acres at Risk of Flooding: 1,220
Percent of Total Acres in Community at Risk: 17.3%
Hurricane Coastal Flooding
Number of Residents in Evac. Zone: 840
Number of Buildings at Risk: 20
Photo: Flickr/Al Camardella Jr.
.png) View Larger +
View Larger +
Prev
Next
#34 Foster
Natural Hazard Scores
Wind Score: 180
Flood Score: 18
Earthquake Score: 120
Tornado Score: 32
Snow Score: 200
Total Score: 790
Flood Damage
Rank: 28
Acres at Risk of Flooding: 2,659
Percent of Total Acres in Community at Risk: 7.94%
Hurricane Coastal Flooding
Number of Residents in Evac. Zone: N/A
Number of Buildings at Risk: N/A
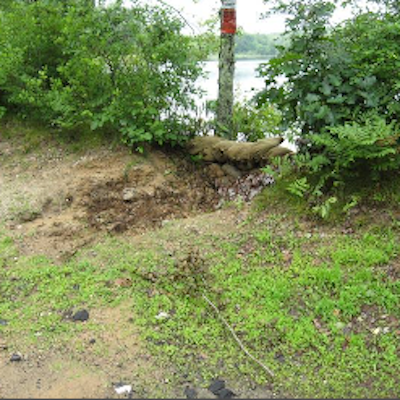
Photo: Flickr/US Geological Survey
 View Larger +
Prev
Next
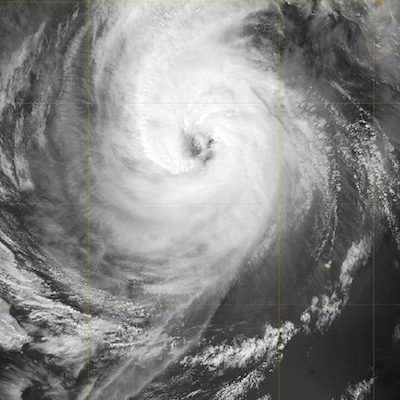
#33 Jamestown
Natural Hazard Scores
Wind Score: 480
Flood Score: 54
Earthquake Score: 180
Tornado Score: 48
Snow Score: 150
Total Score: 1,272
Flood Damage
Rank: 20
Acres at Risk of Flooding: 766
Percent of Total Acres in Community at Risk: 11.95%
Hurricane Coastal Flooding
Number of Residents in Evac. Zone: 3,910
Number of Buildings at Risk: 108
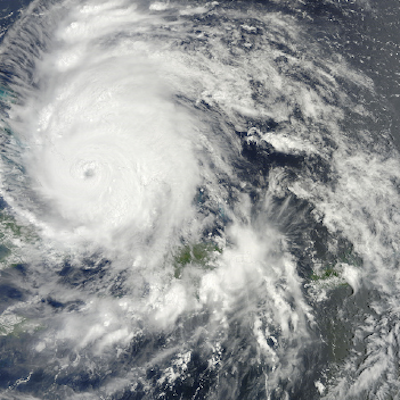
Photo: Flickr/NASA Goddard
 View Larger +
Prev
Next
#32 Hopkinton
Natural Hazard Scores
Wind Score: 600
Flood Score: 54
Earthquake Score: 210
Tornado Score: 56
Snow Score: 175
Total Score: 1,515
Flood Damage
Rank: 21
Acres at Risk of Flooding: 3,412
Percent of Total Acres in Community at Risk: 11.86%
Hurricane Coastal Flooding
Number of Residents in Evac. Zone: N/A
Number of Buildings at Risk: N/A
 View Larger +
Prev
Next
#31 North Smithfield
Natural Hazard Scores
Wind Score: 480
Flood Score: 27
Earthquake Score: 210
Tornado Score: 56
Snow Score: 350
Total Score: 1,543
Flood Damage
Rank: 26
Acres at Risk of Flooding: 1,727
Percent of Total Acres in Community at Risk: 10.63%
Hurricane Coastal Flooding
Number of Residents in Evac. Zone: N/A
Number of Buildings at Risk: N/A
Photo: Flickr/ilovemypit
.png) View Larger +
View Larger +
Prev
Next
#30 Charlestown
Natural Hazard Scores
Wind Score: 680
Flood Score: 144
Earthquake Score: 210
Tornado Score: 56
Snow Score: 175
Total Score: 1,685
Flood Damage
Rank: 4
Acres at Risk of Flooding: 9,276
Percent of Total Acres in Community at Risk: 34.08%
Hurricane Coastal Flooding
Number of Residents in Evac. Zone: 2,510
Number of Buildings at Risk: 838
.png) View Larger +
View Larger +
Prev
Next
#29 Glocester
Natural Hazard Scores
Wind Score: 500
Flood Score: 27
Earthquake Score: 240
Tornado Score: 64
Snow Score: 400
Total Score: 1,711
Flood Damage
Rank: 34
Acres at Risk of Flooding: 2,271
Percent of Total Acres in Community at Risk: 6.2%
Hurricane Coastal Flooding
Number of Residents in Evac. Zone: N/A
Number of Buildings at Risk: N/A
Photo: Flickr/Michael Dolan
 View Larger +
Prev
Next
#28 East Greenwich
Natural Hazard Scores
Wind Score: 720
Flood Score: 63
Earthquake Score: 270
Tornado Score: 72
Snow Score: 225
Total Score: 1,890
Flood Damage
Rank: 17
Acres at Risk of Flooding: 1,500
Percent of Total Acres in Community at Risk: 14.03%
Hurricane Coastal Flooding
Number of Residents in Evac. Zone: 1,240
Number of Buildings at Risk: N/A
Photo: Flickr/Sean Naber
 View Larger +
Prev
Next
#27 Scituate
Natural Hazard Scores
Wind Score: 500
Flood Score: 99
Earthquake Score: 270
Tornado Score: 72
Snow Score: 450
Total Score: 1,931
Flood Damage
Rank: 11
Acres at Risk of Flooding: 6,368
Percent of Total Acres in Community at Risk: 17.98%
Hurricane Coastal Flooding
Number of Residents in Evac. Zone: N/A
Number of Buildings at Risk: N/A
Photo: Flickr/US Geological Survey
 View Larger +
Prev
Next
#26 Middletown
Natural Hazard Scores
Wind Score: 800
Flood Score: 36
Earthquake Score: 300
Tornado Score: 80
Snow Score: 250
Total Score: 2,066
Flood Damage
Rank: 37
Acres at Risk of Flooding: 499
Percent of Total Acres in Community at Risk: 5.63%
Hurricane Coastal Flooding
Number of Residents in Evac. Zone: 2,012
Number of Buildings at Risk: N/A
Photo: Flickr/Ani Carrington
 View Larger +
Prev
Next
#25 Central Falls
Natural Hazard Scores
Wind Score: 740
Flood Score: 36
Earthquake Score: 300
Tornado Score: 80
Snow Score: 500
Total Score: 2,256
Flood Damage
Rank: 16
Acres at Risk of Flooding: 121
Percent of Total Acres in Community at Risk: 14.58%
Hurricane Coastal Flooding
Number of Residents in Evac. Zone: N/A
Number of Buildings at Risk: N/A
 View Larger +
Prev
Next
#24 Tiverton
Natural Hazard Scores
Wind Score: 880
Flood Score: 54
Earthquake Score: 330
Tornado Score: 88
Snow Score: 275
Total Score: 2,287
Flood Damage
Rank: 22
Acres at Risk of Flooding: 2,335
Percent of Total Acres in Community at Risk: 11.51%
Hurricane Coastal Flooding
Number of Residents in Evac. Zone: 3,080
Number of Buildings at Risk: 191
 View Larger +
Prev
Next
#23 Warren
Natural Hazard Scores
Wind Score: 800
Flood Score: 198
Earthquake Score: 330
Tornado Score: 88
Snow Score: 275
Total Score: 2,351
Flood Damage
Rank: 5
Acres at Risk of Flooding: 1,431
Percent of Total Acres in Community at Risk: 33.99%
Hurricane Coastal Flooding
Number of Residents in Evac. Zone: 7,520
Number of Buildings at Risk: 534
 View Larger +
Prev
Next
#22 Lincoln
Natural Hazard Scores
Wind Score: 740
Flood Score: 45
Earthquake Score: 360
Tornado Score: 96
Snow Score: 600
Total Score: 2,561
Flood Damage
Rank: 35
Acres at Risk of Flooding: 752
Percent of Total Acres in Community at Risk: 6.12%
Hurricane Coastal Flooding
Number of Residents in Evac. Zone: N/A
Number of Buildings at Risk: N/A
 View Larger +
Prev
Next
#21 Narragansett
Natural Hazard Scores
Wind Score: 1,180
Flood Score: 198
Earthquake Score: 390
Tornado Score: 104
Snow Score: 325
Total Score: 2,977
Flood Damage
Rank: 2
Acres at Risk of Flooding: 4,224
Percent of Total Acres in Community at Risk: 39.2
Hurricane Coastal Flooding
Number of Residents in Evac. Zone: 9,030
Number of Buildings at Risk: N/A
 View Larger +
Prev
Next
#20 Portsmouth
Natural Hazard Scores
Wind Score: 1,120
Flood Score: 216
Earthquake Score: 420
Tornado Score: 112
Snow Score: 350
Total Score: 3,058
Flood Damage
Rank: 7
Acres at Risk of Flooding: 4,238
Percent of Total Acres in Community at Risk: 26.64
Hurricane Coastal Flooding
Number of Residents in Evac. Zone: 6,530
Number of Buildings at Risk: 1,078
Photo: Flickr/Core Burn
 View Larger +
Prev
Next
#19 Smithfield
Natural Hazard Scores
Wind Score: 920
Flood Score: 72
Earthquake Score: 420
Tornado Score: 112
Snow Score: 700
Total Score: 3,094
Flood Damage
Rank: 30
Acres at Risk of Flooding: 1,201
Percent of Total Acres in Community at Risk: 6.74%
Hurricane Coastal Flooding
Number of Residents in Evac. Zone: N/A
Number of Buildings at Risk: N/A
View Larger +
Prev
Next
#18 Barrington
Natural Hazard Scores
Wind Score: 860
Flood Score: 243
Earthquake Score: 420
Tornado Score: 112
Snow Score: 600
Total Score: 3,066
Flood Damage
Rank: 1
Acres at Risk of Flooding: 2,417
Percent of Total Acres in Community at Risk: 40.97%
Hurricane Coastal Flooding
Number of Residents in Evac. Zone: 13,890
Number of Buildings at Risk: 784
 View Larger +
Prev
Next
#17 Bristol
Natural Hazard Scores
Wind Score: 1,200
Flood Score: 135
Earthquake Score: 480
Tornado Score: 128
Snow Score: 400
Total Score: 3,303
Flood Damage
Rank: 8
Acres at Risk of Flooding: 1,745
Percent of Total Acres in Community at Risk: 26.28
Hurricane Coastal Flooding
Number of Residents in Evac. Zone: 5,330
Number of Buildings at Risk: 483
 View Larger +
Prev
Next
#16 Coventry
Natural Hazard Scores
Wind Score: 1,160
Flood Score: 81
Earthquake Score: 480
Tornado Score: 128
Snow Score: 550
Total Score: 3,359
Flood Damage
Rank: 38
Acres at Risk of Flooding: 2,147
Percent of Total Acres in Community at Risk: 5.26%
Hurricane Coastal Flooding
Number of Residents in Evac. Zone: N/A
Number of Buildings at Risk: N/A
 View Larger +
Prev
Next
#15 Burrillville
Natural Hazard Scores
Wind Score: 906
Flood Score: 63
Earthquake Score: 510
Tornado Score: 136
Snow Score: 850
Total Score: 3,539
Flood Damage
Rank: 32
Acres at Risk of Flooding: 2,394
Percent of Total Acres in Community at Risk: 6.39
Hurricane Coastal Flooding
Number of Residents in Evac. Zone: N/A
Number of Buildings at Risk: N/A
 View Larger +
Prev
Next
#14 Johnston
Natural Hazard Scores
Wind Score: 1,180
Flood Score: 18
Earthquake Score: 510
Tornado Score: 136
Snow Score: 850
Total Score: 3,714
Flood Damage
Rank: 25
Acres at Risk of Flooding: 1,677
Percent of Total Acres in Community at Risk: 10.7%
Hurricane Coastal Flooding
Number of Residents in Evac. Zone: N/A
Number of Buildings at Risk: N/A
.png) View Larger +
View Larger +
Prev
Next
#13 South Kingstown
Natural Hazard Scores
Wind Score: 1,580
Flood Score: 171
Earthquake Score: 540
Tornado Score: 144
Snow Score: 450
Total Score: 3,965
Flood Damage
Rank: 6
Acres at Risk of Flooding: 12,168
Percent of Total Acres in Community at Risk: 29.51
Hurricane Coastal Flooding
Number of Residents in Evac. Zone: 7,310
Number of Buildings at Risk: 1,315
 View Larger +
Prev
Next
#12 Cumberland
Natural Hazard Scores
Wind Score: 1,180
Flood Score: 117
Earthquake Score: 600
Tornado Score: 160
Snow Score: 1,000
Total Score: 4,257
Flood Damage
Rank: 23
Acres at Risk of Flooding: 2,098
Percent of Total Acres in Community at Risk: 11.46%
Hurricane Coastal Flooding
Number of Residents in Evac. Zone: N/A
Number of Buildings at Risk: N/A
.png) View Larger +
View Larger +
Prev
Next
#11 Westerly
Natural Hazard Scores
Wind Score: 1,880
Flood Score: 189
Earthquake Score: 570
Tornado Score: 152
Snow Score: 475
Total Score: 4,406
Flood Damage
Rank: 9
Acres at Risk of Flooding: 5,604
Percent of Total Acres in Community at Risk: 26.15%
Hurricane Coastal Flooding
Number of Residents in Evac. Zone: 7,120
Number of Buildings at Risk: 1,342
 View Larger +
Prev
Next
#10 West Warwick
Natural Hazard Scores
Wind Score: 1,480
Flood Score: 99
Earthquake Score: 660
Tornado Score: 176
Snow Score: 925
Total Score: 4,660
Flood Damage
Rank: 19
Acres at Risk of Flooding: 629
Percent of Total Acres in Community at Risk: 12.21%
Hurricane Coastal Flooding
Number of Residents in Evac. Zone: N/A
Number of Buildings at Risk: N/A
 View Larger +
Prev
Next
#9 North Providence
Natural Hazard Scores
Wind Score: 1,400
Flood Score: 81
Earthquake Score: 690
Tornado Score: 184
Snow Score: 1,150
Total Score: 4,885
Flood Damage
Rank: 33
Acres at Risk of Flooding: 238
Percent of Total Acres in Community at Risk: 6.3%
Hurricane Coastal Flooding
Number of Residents in Evac. Zone: N/A
Number of Buildings at Risk: N/A
 View Larger +
Prev
Next
#8 North Kingstown
Natural Hazard Scores
Wind Score: 1,760
Flood Score: 297
Earthquake Score: 690
Tornado Score: 184
Snow Score: 575
Total Score: 4,886
Flood Damage
Rank: 10
Acres at Risk of Flooding: 5,538
Percent of Total Acres in Community at Risk: 19.12%
Hurricane Coastal Flooding
Number of Residents in Evac. Zone: 7,820
Number of Buildings at Risk: 850
Photo: Flickr/Jessica Merz
 View Larger +
Prev
Next
#7 Newport
Natural Hazard Scores
Wind Score: 1,880
Flood Score: 306
Earthquake Score: 720
Tornado Score: 192
Snow Score: 600
Total Score: 5,138
Flood Damage
Rank: 3
Acres at Risk of Flooding: 2,078
Percent of Total Acres in Community at Risk: 37.24%
Hurricane Coastal Flooding
Number of Residents in Evac. Zone: 10,590
Number of Buildings at Risk: 993
Photo: Flickr/ChalkyLives
 View Larger +
Prev
Next
#6 Woonsocket
Natural Hazard Scores
Wind Score: 2,260
Flood Score: 99
Earthquake Score: 1,110
Tornado Score: 296
Snow Score: 1,850
Total Score: 7,835
Flood Damage
Rank: 29
Acres at Risk of Flooding: 356
Percent of Total Acres in Community at Risk: 6.95%
Hurricane Coastal Flooding
Number of Residents in Evac. Zone: N/A
Number of Buildings at Risk: N/A
 View Larger +
Prev
Next
#5 East Providence
Natural Hazard Scores
Wind Score: 2,720
Flood Score: 225
Earthquake Score: 1,410
Tornado Score: 376
Snow Score: 2,350
Total Score: 9,901
Flood Damage
Rank: 12
Acres at Risk of Flooding: 1,610
Percent of Total Acres in Community at Risk: 17.37%
Hurricane Coastal Flooding
Number of Residents in Evac. Zone: 7,430
Number of Buildings at Risk: N/A
 View Larger +
Prev
Next
#4 Cranston
Natural Hazard Scores
Wind Score: 3,820
Flood Score: 360
Earthquake Score: 1,950
Tornado Score: 520
Snow Score: 3,250
Total Score: 13,800
Flood Damage
Rank: 27
Acres at Risk of Flooding: 1,541
Percent of Total Acres in Community at Risk: 8.25%
Hurricane Coastal Flooding
Number of Residents in Evac. Zone: 2,330
Number of Buildings at Risk: 640
.png) View Larger +
View Larger +
Prev
Next
#3 Pawtucket
Natural Hazard Scores
Wind Score: 4,880
Flood Score: 117
Earthquake Score: 2,160
Tornado Score: 576
Snow Score: 3,600
Total Score: 15,653
Flood Damage
Rank: 31
Acres at Risk of Flooding: 392
Percent of Total Acres in Community at Risk: 6.7%
Hurricane Coastal Flooding
Number of Residents in Evac. Zone: 1,150
Number of Buildings at Risk: N/A
 View Larger +
Prev
Next
#2 Warwick
Natural Hazard Scores
Wind Score: 5,400
Flood Score: 684
Earthquake Score: 2,400
Tornado Score: 640
Snow Score: 2,875
Total Score: 16,799
Flood Damage
Rank: 15
Acres at Risk of Flooding: 3,923
Percent of Total Acres in Community at Risk: 16.51%
Hurricane Coastal Flooding
Number of Residents in Evac. Zone: 28,760
Number of Buildings at Risk: 2,594
 View Larger +
Prev
Next
#1 Providence
Natural Hazard Scores
Wind Score: 10,980
Flood Score: 486
Earthquake Score: 5,850
Tornado Score: 1,560
Snow Score: 9,750
Total Score: 40,326
Flood Damage
Rank: 18
Acres at Risk of Flooding: 1,669
Percent of Total Acres in Community at Risk: 13.58%
Hurricane Coastal Flooding
Number of Residents in Evac. Zone: 1,010
Number of Buildings at Risk: 481
Related Articles
Enjoy this post? Share it with others.


.png)


.png)
.png)


.png)

.png)


.png)


_80_80_c1.png)


_80_80_c1.png)
_80_80_c1.png)


_80_80_c1.png)

_80_80_c1.png)


_80_80_c1.png)


