
Gist by the Numbers: Achievement Gap Failing to Improve
Thursday, May 23, 2013
Test scores are up. So are graduation rates. But the gap between white students and those who are minorities, have disabilities, or are not native English speakers has either stagnated or worsened in the four years that Deborah Gist has been at the helm of the Rhode Island Education Department.

Students overall are doing better at school than they were before summer 2009, when Gist arrived. The improvement in test scores and other measures, however, has been modest. The four-year graduation rate went up about one percent to 77 percent. The number of students in all grades passing the NECAP math test is four percentage points higher, on average, than four years ago. The average reading score is up five points. (See below tables.)
But the statewide picture becomes more complicated when viewed district-by-district. “It’s kind of a mixed bag,” said Tim Duffy, executive director of the Rhode Island Association of School Committees.
GET THE LATEST BREAKING NEWS HERE -- SIGN UP FOR GOLOCAL FREE DAILY EBLASTHe contrasted districts like Smithfield—where NECAP math scores among eleventh graders leapt forward by 23 percent from 2011 to 2012—with urban ones like Central Falls and Woonsocket, where he said scores have either stagnated or seen marginal improvement. In Central Falls, math scores for all grades dropped by three percent between 2011 and 2012. In Woonsocket they increased by one percent.
“Changing educational performance is like turning a battleship,” said Tim Ryan, executive director of the Rhode Island School Superintendents Association. “It’s not something you can see immediate results from in a short period of time.”
Achievement gap getting wider for some
But some question whether the state is even turning in the right direction. The state may be seeing gains with average students, but three key groups of students are being left behind—those with disabilities, non-native English speakers, and low-income students who don’t read at grade level, said Jean Ann Guliano, a former school committee member in East Greenwich and a one-time Moderate Party candidate for lieutenant governor.
“In fact, the gap seems to be getting wider,” said Guliano, a parent of a special-needs child.

In 2008, white students in all grades were 76 proficient on the reading NECAP test against 30 percent for students with learning disabilities, a gap of 46 points. By 2012, white students were scoring at 82 percent proficient while students with disabilities were 29 percent, a 53-point gap.
The achievement gap widened in four other areas during those four years:
■ NECAP reading: the white to non-native English speaker gap increased from 55 to 57 points
■ NECAP math: the white to learning disability gap increased from 40 to 50 points
■ NECAP math: the white to non-native English speaker gap increased from 44 to 48 points
■ NECAP math: the white to black gap inched up from 30 to 31 points
In two areas, the gap barely budged, dipping by a point for Hispanic and low-income students on the reading NECAP. Over four years, there was no change in the white-to-Hispanic and white-to-low-income gaps on the math NECAP.
Those gaps widened even as students in many of the non-white students groups still performed better. In fact, between 2008 and 2012, every single group improved except one: students with disabilities on the math NECAP. Nonetheless, the improvement in other groups often did not keep pace with white students. (See below tables.)
“Quite frankly, I think superintendent salaries have gone up more than real test scores,” said Jim McGwin, head of the North Kingstown Taxpayers Organization, who has specialized in school finance issues.
“We’re not preparing kids in Rhode Island for vocations,” McGwin added. “They’re being left behind.” He sees the same problem for college-bound students, noting the high numbers of students at CCRI who take remedial math, reading, and writing courses. As much as two-thirds need remedial work.
Race to the Top, but for whom?
Ryan praised Gist for securing what was initially $75 million in federal Race to the Top funds, to help align curriculum, teacher training, assessments, and teacher evaluations. “I think it sets the stage for a lot of improvement,” Ryan said.
But Guliano, who backed the Race to the Top while on the school committee, says the very students it’s meant to help—those students who face some kind of disadvantage—are missing out on all the gains being made by students statewide. “That has gotten lost in all this reform stuff,” Guliano said.
She says the NECAP is not an accurate or fair measure of performance for some students, especially those with disabilities. And, as the gap widens between those students and others, they are being penalized for their poor performance, now that the NECAP is being made a graduation requirement, Guliano said. “It’s just a horrible state of affairs for these particular kids,” she said.
Frank Flynn, the head of the Rhode Island Federation of Teachers and Health Professionals, said the use of the NECAP as graduation requirement will have a negative impact on graduation rates, reversing the small gains the state has made in recent years.

Guliano said the state is expecting too much out of the NECAP, using it not only to measure student performance, but also how their teachers are doing. “The emperor has no clothes, so to speak, when it comes to standardized tests,” Guliano said.
Flynn said the state is still striving for the best way to improve the quality of education for all students. “I don’t think we’ve really found the best way to do that at this point,” he said.
State fails to meet 32 out of 33 goals
The Rhode Island Department of Education, at the behest of Gist, has set 33 targets for statewide student performance. The bulk of them are related to closing the achievement gap. A few involve graduation rates and how students do after high school.
In 2012, the state reached just one out of those 33 targets: 75.7 percent of high school graduates finished one year of college within two years of enrolling in it. The goal for that year had been 65 percent.
“Our biggest challenge remains the persistent achievement gaps. In 2009, Commissioner Gist established the very ambitious goal of reducing achievement gaps by 50 percent by 2015,” said RIDE spokesman Elliot Kreiger. “[W]e have made progress on closing many of these achievement gaps, but certainly not at the rate we need to see to meet the 2015 goals.”

Even though the state fell short, it saw progress on about a third of those goals. (See below list of all the goals.) Overall, the gaps have narrowed in 11 areas, according to a RIDE report. In previous years, however, the state met more of its targets. In 2010, 14 out of the 33 goals were met.
Flynn declined to explicitly criticize Gist for not meeting the goals she has set for herself, even though he noted that the new evaluation system she has promoted puts teachers at risk of negative evaluations if their students do not meet the so-called Student Learning Objectives, rather than measuring them by whether students simply improved. Instead, Flynn said educators across the board should be evaluated by whether their students showed any improvement.
But others said Gist, whose contract has come up for renewal, should be judged in the same way that she wants teachers judged. “I fully support judging the Commissioner by the same standards she has set for the schools and the teachers in them,” said Tom Sgouros, a progressive blogger.
“Judging Gist by the same standard teachers are being judged by in the new evaluation system, she would get an overwhelmingly negative mark,” he added.
By national standards, RI students improve
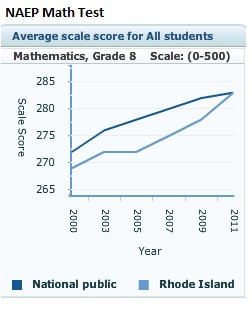
Some argue that the NAEP test, which is administered every two years to fourth and eighth graders across the country, is a better standard with which to gauge how Rhode Island students are doing. Because it offers one yardstick against which to measure all students, it is known as the “Nation’s Report Card.”
These test results reinforce what the NECAP shows: overall, Ocean State students are improving. In 2011, for the first time, Rhode Island fourth and eighth graders were “at or above the national average” the math and reading tests, noted RIDE spokesman Elliot Krieger. (See charts for more.)
“The NAEP data show that performance is better now than it was when she arrived. But they also show that this is just a continuation of improvement that began years before,” said Tom Sgouros, who has written frequently on testing issues.

For example, between 2005 and 2009, the number of eighth graders scoring proficient on the math NAEP increased from 23 to 28 percent. For fourth graders, the percent proficient went from 31 to 39 during the same period.
“I don’t see how the Commissioner’s policies could really have had much at all to do with any improvement. For the most part, the important policies associated with her have little to do with providing professional development or increasing the quality or richness of instruction, and that’s the source of improvement,” Sgouros added. “Her policies have to do with measurements and demands for performance to meet arbitrary thresholds. She has confused helping schools achieve with demanding that they do.”
Other bright spots
Test scores receive much of the attention, but there are a number of other measures of how students are doing. Krieger provided GoLocalProv with a May 20 RIDE report, simply titled “Results,” which highlighted a number of other positive indicators, including increased use of the AP test and improvements in graduation rates.

In 2012, 3,400 students participated in the Advanced Placement program, which allows students to earn college credits in high school. The number taking the test that year was up 11.4 percent, capping a five-year trend of increased participation. Only six state high schools did not have any AP participation, according to the report.
In addition to the one-point increase in the four-year rate, the five-year graduation rate bumped up by four points to 81 percent. The report said it was the “highest point ever” using the current system of measuring the rate.
“These achievements and challenges aside, Commissioner Gist is most proud that, under her leadership, Rhode Island has put in place many new policies and initiatives that will improve teaching and learning for years to come,” Krieger said. (Gist was not available for an interview.)
Krieger also provided a list of about 20 new policies and initiatives begun under Gist. They included: annual teacher evaluations, an end to seniority as the “sole basis” for staffing decisions, an induction program to aid new teachers, a new certification system for teachers, the transitioning of more than 6,000 educators to the Common Core standards, alignment of curriculum with the Common Core, the new statewide education funding formula, and the creation of a “performance-management system” for RIDE staff.
Stephen Beale can be reached at [email protected]. Follow him on Twitter @bealenews
NECAP TEST DATA
Note: The first two tables show NECAP results for reading and math. The third table is the list of RIDE goals for student performance. The numbers listed are percentages. The NECAP was taken in the fall of each listed year. For example, the numbers for 2012 would correspond to the 2012-2013 school year.
Key: LEP = Limited English Proficiency. IEP = Individual Education Plan (refers to students with disabilities in special education).
Source: Rhode Island Department of Education.


Related Articles
- The Top High Schools in Rhode Island 2013
- Education Crisis: 1 in 5 Providence Schools Failing
- EXCLUSIVE: Financially Mismanaged Central Falls Schools Face $5.6M Deficit
- Education Crisis: Four Providence Schools Still Have No Plans For Next Year
- Commissioner Gist Recommends Closure of Failing Providence Charter School
- EXCLUSIVE: Senate Committee Investigating Central Falls Schools
- EXCLUSIVE: Which Providence Schools Might Close?
- Former US Education Official Rips Commissioner Gist & RI’s Reform Efforts
- EXCLUSIVE: State Senate Launches Probe Into Central Falls Schools
- Providence Schools in Crisis: 37% of Students are ‘Chronically Absent’
- Gist Says State Working to Lower Special Education Costs
- Senator Calls for Forensic Audit of Central Falls Schools
- NEW: Gist Delivers State of Education Address
- Violence on the Rise at Central Falls Schools
- PODCAST: Former Education Head Rips Gist
- 40 Percent Of Providence Schools Could Be Failing
- The Top High Schools in Rhode Island 2012
- EXCLUSIVE: No Help For Failing Providence Schools This Year
