Small Biz in a Digital Age: Analytics - Know Your Options
Monday, December 15, 2014
GoLocalProv Business Team
The world of business is moving faster -- hyper fast. Small businesses face the challenge of trying to keep up and innovate their business to create an advantage.
This week, GoLocal brings you a look at how to select where to get your analytics data from and the different options and implications of data use for your small business. This series is sponsored by BlueCross BlueShield of Rhode Island - but know they have no editorial review or control. The goal is to help small businesses compete and grow in a period of tremendous change.
GET THE LATEST BREAKING NEWS HERE -- SIGN UP FOR GOLOCAL FREE DAILY EBLAST
The Importance of Analytics Data
Understanding your options and outlets for running analytics reports can help your small business keep track of the impact its marketing has on customers, and give you insight into what you can do to improve your reach online. Analytics platforms allow you to cull and analyze your social media data, website SEO, and traffic from new and returning business.
Many sites are streamlined to produce real-time data that is digestible for the busy small business owner, despite shocking statistics of their underuse: according to a recent survey by Small Business Group 18% of small, and about 57% of medium businesses utilize "business intelligence and analytics solutions" which puts most companies at a disadvantage because about 90% of prospects will visit your website before they call your office.
This means that a wealth of untapped information about where your customers are coming from, what they are interested in purchasing and how many eyes are on your business’ website is being ignored by many business owners.
Analytics Trends
IBM recently announced that it will be providing businesses of all sizes with free data and prediction analytics with Watson Analytics. The cloud-based service will be in the public beta with the option to buy more data later on - allowing small business owners to try out the system before they invest.
"Small businesses think long and hard about where to invest the resources they have," says John Mason, general manager, midmarket at IBM. "[This includes] where they can make the most impact and best deliver real innovation to the market. For most small businesses, this means not investing heavily in an IT department."
This trend is not uncommon among other analytics sites who often allow small business owners to take advantage of their data software as a sort of “freemium” service.
Spyfu for example, offers a free version of their services that allows you to keep an eye on competitor advertisements to see what keywords overlap from your site and theirs when customers perform organic searches - helping your company differentiate. Woorank is another service that allows you to run reports on your website traffic, demographics, and SEO analytics for free before you decide to buy.
Bottom Line
Be selective with your business’ analytics services and see what each different platform offers before you decide to shell out monthly for data. It’s always a good idea to investigate the type of analytics that services or social media platforms may already offer if you already use their websites or advertising options - Google Analytics is one of the most user-friendly options, especially if you are already promoting your business through their organic searches.
Most importantly, focus on what information will suit your business’ needs: if your company is looking to get more new viewers to the website - find a service that tracks “unique” visits, and if your business is looking to expand - think about getting some data on where your customer’s purchase orders are going, or coming from, geographically. Analytics services can only be as helpful as the data they provide - it’s up to you to put it to good use and implement your data to help your business improve.
Related Slideshow: RI Business Rankings in US
See how Rhode Island stacked up.
 View Larger +
Prev
Next
WalletHub
Rhode Island has 2015's eighth highest insurance premium penalties for high risk drivers, according to a WalletHub report.
Rhode Island ranks fifth overall in the category of speeding over 20 mph annual premium increase at $482. While ranking third overall in the category of 2 accidents annual premium increase at $2,721.
Rhode Island ranks ninth overall under the reckless driving annual premium increase at $749.
View Larger +
Prev
Next
WalletHub
Rhode Island has been ranked as the 8th most eco-friendly state in the country, according to a recent study by WalletHub.
Rhode Island ranks third in environmental quality and 16th in Eco-Friendly Behaviors Ran landing them in 8th overall.
RI is behind Washington and New Hampshire who are in the six and seven spots respectively, and in front of Connecticut and Hawaii who come in at the nine and ten spot.
View Larger +
Prev
Next
WalletHub
Rhode Island is 2015's 4th Worst State to be a taxpayer, according to a recent WalletHub report.
Rhode Island ranks 48th of 51 with an average state and local tax price of $7,159 which is good for a 27% difference from the national average.
The states that are directly behind Rhode Island are Wisconsin at $7,159, Nebraska at $7,298 and Illinois at $7,719 for a 37% difference from the national average.
View Larger +
Prev
Next
WalletHub
Rhode Island has the highest vehicle property taxes in the country, paying an average of $1,133 according to a report from WalletHub.
Virginia and Kansas are the two states just ahead of Rhode Island in the 49 and 50 spots, paying $962 and $905 respectively.
RI also ranks 42nd in average real estate tax, paying an average of $2,779, according to the WalletHub report.
 View Larger +
Prev
Next
Gallup
Providence-metro ranks at the bottom for job creation in 2014
Rhode Island has been ranked amongst the worst in job creation, according to a recent survey done by Gallup.
Gallup gives the Prov-metro area an index score of 23, the lowest score is the New York- New Jersey area with 20.
Salt Lake City, Utah and Austin-round Rock, Texas rank the highest with a score of 37.
See the rest of the rankings here.
 View Larger +
Prev
Next
Forbes
The 2014 state rankings by Forbes has just been released and Rhode Island moved up two spots from #48 in 2013 to #46 in 2014.
What does Forbes say about RI's business environment"
After Michigan and Illinois, Rhode Island has experienced the third worst net migration out of its state in the country over the past five years. With a recent unemployment rate of 7.6%—lower than only Georgia and Mississippi—residents are leaving the state in search of jobs. Rhode Island has been stuck in the bottom five overall for six straight years. One plus: labor costs are 5% below the national average, which stands out in the expensive Northeast.
_400_400_90_400_400_90.jpg) View Larger +
View Larger +
Prev
Next
Tax Foundation
Findings from The State Business Tax Climate Index were released this morning by Tax Foundation which found Rhode Island to have the 45th best tax climate for businesses for 2015. The state's rank has not changed since last year after The Index analyzed 100 different tax variables in multiple categories.
Read more about the report here
 View Larger +
Prev
Next
Thumbtack/Kauffman
Providence is the second worst city in America for small business, according to a new survey conducted by Thumbtack.com and the Kauffman Foundation.
More than 12,000 small businesses in 82 cities across the country participate in the survey. Providence received an overall "F" grade for small business friendliness.
Full Survey Results Here.
 View Larger +
Prev
Next
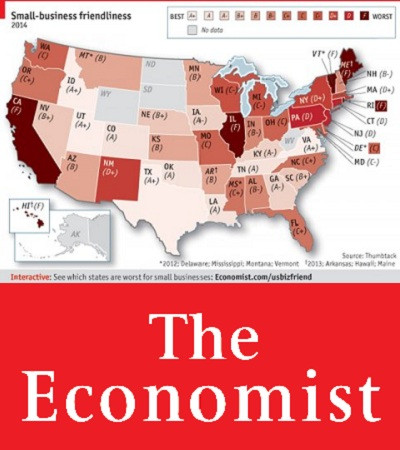
The Economist
Small Business Friendliness Grade: F
The Economist grades states on an A+ to F grading scale for its small business climate. Rhode Island is one of just 6 states to earn an "F" grade.
Overbearing bureaucracy and excessive licensing is stifling small business in America.
Read More About The Economist Grade Here
 View Larger +
Prev
Next
Forbes
Forbes ranks each state in business costs, economic climate, and growth prospects. RI is third worst in 2013.
The most damning in the commentary:
After Michigan, Rhode Island has experienced the second worst net migration in the country over the past five years.
Read More About Forbes Ranking Here
_400_400_90.jpg) View Larger +
View Larger +
Prev
Next
Tax Foundation
#46 Tax Foundation
Tax Foundation ranks each state in corporate tax rank, sales tax rank, and unemployment insurance tax rank.
Rhode Island and the other states in the bottom ten suffer from the same afflictions: complex, non-neutral taxes with comparatively high rates.
Read More About Tax Foundation Ranking Here
 View Larger +
Prev
Next
ALEC
#47 ALEC
ALEC ranks each state in economic performance and outlook.
Although Rhode Island ranked low in economic performance, a forward-looking forecast is based on the state’s standing in 15 important state policy variables. Some of these variables include top marginal personal income tax rate and sales tax burden.
Read More About ALEC Ranking Here
 View Larger +
Prev
Next
Kauffman Foundation
#50 Kauffman Foundation
Kauffman Foundation ranks each state in entrepreneurship.
Entrepreneurial activity generally is highest in Western and Southern states
and lowest in Midwestern and Northeastern states.
Read More About Kauffman Ranking Here
 View Larger +
Prev
Next
Free Enterprise
#47 Free Enterprise
Free Enterprise ranks each state in performance, exports, innovation + entrepreneurship, business climate, talent pipeline, infrastructure.
Rhode Island has continued to feel the direct impact and ripples from the recent recession—it ranks 47th overall in economic performance. However, positive rankings of 15th in talent pipeline and 16th in innovation and entrepreneurship suggest the existence of a foundation on which to build the future.
Read More About Free Enterprise Ranking Here
View Larger +
Prev
Next
Gallup
10th Worst in Gallup's Annual Ranking of State Job Markets 2014
Rhode Island has been ranked 10th worst for job creation in Gallup's annual ranking of state job markets in 2014 with a job creation index number of 21
Rhode Island is one of two (Connecticut) states to rank in the bottom ten each year since 2008.
The 2014 State level findings have were drawn from 201,254 interviews with employed adults across the nation.
See the full list of rankings here.
Related Articles
Enjoy this post? Share it with others.


_400_400_90_400_400_90.jpg)


_400_400_90.jpg)


_400_400_90_80_80_90_c1.jpg)


_80_80_90_c1.jpg)


