Saul Kaplan: Emerging Tech Is Society’s Shadow Future

Thursday, June 11, 2015


View Larger +

Buckle up fellow design and innovation junkies we are the proverbial kids in a candy store stocked with a growing inventory of brain-exploding emerging technologies. The shelves of our candy store are overflowing with exciting new technologies including genomics, robotics, Internet of things, big data, artificial intelligence, drones, and 3D printing to name just a few. Any one of these emerging technologies alone could change the world. Resist the temptation to gorge on any one of them before sampling the full cross section of possibility. Perhaps a better metaphor after appreciating the full breadth of possibility is to feel like a kid in a sandbox. A sandbox filled with both existing and nascent technologies beckoning design and innovation junkies like us to come play together to unleash the adjacent possible. To combine and recombine technologies in new ways to unleash a steady stream of transformational business models and to change the way we solve the important social challenges of our time. You know, little system challenges like education, healthcare and government!

Nascent is a beautiful and optimistic word. Emerging technology stories are about capabilities in their formative stage when they are most malleable and offer the greatest possibility frontier. Nascent technologies are the stem cells of society’s future. There’s a reason so much biology research focuses on stem cells. Stem cells are undifferentiated; they have the potential of becoming differentiated into most other kinds of cells. The hopes of human regenerative medicine lie on stem cell research and application. I’ve always been fascinated by the salamander, the highest order animal capable of regeneration. When a salamander loses or injures a body part stem cells rush to the cite enabling it to regenerate the body part. It’s amazing. Nascent technologies are undifferentiated, they have unlimited potential for regeneration to unleash incredible value. We live in a magic time when technology is no longer a limiting factor in solving the big social challenges we face. It’s on us humans to unleash our inner newts!

A must-have superpower in the 21st century is the capability to connect the dots across both emerging and existing technologies. Stuart Kaufman first described the untapped potential of what could be as the “adjacent possible”. Most innovation isn’t about inventing new technology but merely the recombination of existing parts assembled in new ways to solve a problem or deliver value. Everything we need to innovate is in our sandbox and can be found at the edges between our sectors, disciplines, and technological silos. Innovation is all about exploring the adjacent possible. Author Stephen Johnson says it well: “Ideas are works of bricolage. They are, almost inevitably, networks of other ideas. We take the ideas we’ve stumbled across, and we jigger them together into some new shape. The adjacent possible is a kind of shadow future, hovering on the edges of the present state of things, a map of all the ways in which the present can reinvent itself.” (The Genius of the Tinkerer, Wall Street Journal, September 25, 2010)

GET THE LATEST BREAKING NEWS HERE -- SIGN UP FOR GOLOCAL FREE DAILY EBLAST

The most important applications for emerging technologies haven’t been imagined yet. Business model designers have an important role to play in helping us to unleash the adjacent possible. Design helps us focus on outputs rather than just inputs. Invention is great but innovation is a better way to deliver value. It isn’t an innovation until it solves a problem and value is actually delivered in the real world. Far too many conflate invention and innovation. They are different. Design is key to getting the promise of these nascent technologies out of the lab, off of the white board, out of consulting decks and in to the real world. It’s time for designers to stop trying to make the argument that design thinking and process is important. We stipulate that design is important. It’s time for designers to create the conditions and tools enabling everyone to design. It’s time to move the design conversation to a new, actionable, place. Welcome to the sandbox of adjacent possibilities. Grab your pail and shovel. Let’s design a better future together.

This post is adapted from the Forward I wrote for the book, Designing For Emerging Technologies, by Jon Follett published by O’Reilly.

View Larger +

Saul Kaplan is the Founder and Chief Catalyst of the Business Innovation Factory (BIF). Saul shares innovation musings on his blog at It’s Saul Connected and on Twitter at @skap5.


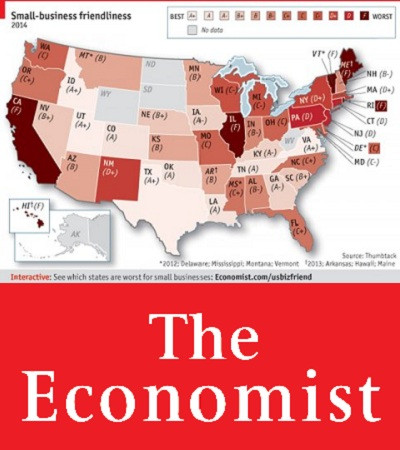
Related Slideshow: RI Business Rankings in US

See how Rhode Island stacked up.

View Larger +
Prev Next

WalletHub

Rhode Island has 2015's eighth highest insurance premium penalties for high risk drivers, according to a WalletHub report. 

Rhode Island ranks fifth overall in the category of speeding over 20 mph annual premium increase at $482. While ranking third overall  in the category of 2 accidents annual premium increase at $2,721.

Rhode Island ranks ninth overall under the reckless driving annual premium increase at $749. 

View Larger +
Prev Next

WalletHub

Rhode Island has been ranked as the 8th most eco-friendly state in the country, according to a recent study by WalletHub.

Rhode Island ranks third in environmental quality and 16th in Eco-Friendly Behaviors Ran landing them in 8th overall.

RI is behind Washington and New Hampshire who are in the six and seven spots respectively, and in front of Connecticut and Hawaii who come in at the nine and ten spot. 

View Larger +
Prev Next

WalletHub

Rhode Island is 2015's 4th Worst State to be a taxpayer, according to a recent WalletHub report. 

Rhode Island ranks 48th of 51 with an average state and local tax price of $7,159 which is good for a 27% difference from the national average. 

The states that are directly behind Rhode Island are Wisconsin at $7,159, Nebraska at $7,298 and Illinois at $7,719 for a 37% difference from the national average.

View Larger +
Prev Next

WalletHub

Rhode Island has the highest vehicle property taxes in the country, paying an average of $1,133 according to a report from WalletHub.

Virginia and Kansas are the two states just ahead of Rhode Island in the 49 and 50 spots, paying $962 and $905 respectively. 

RI also ranks 42nd in average real estate tax, paying an average of $2,779, according to the WalletHub report.

View Larger +
Prev Next

WalletHub

WalletHub has ranked Rhode Island as the 7th worst state to be rich in in a recent in depth analysis of 2015's Best States to be Rich or Poor From a Tax Perspective

On a scale with 1 being the best, and 25 being average, Rhode Island ranks 37th in low income earners, 42 in middle income earners and 45th in high income earners. 

To see the full report, click here. 

View Larger +
Prev Next

Gallup

Providence-metro ranks at the bottom for job creation in 2014  

Rhode Island has been ranked amongst the worst in job creation, according to a recent survey done by Gallup. 

Gallup gives the Prov-metro area an index score of 23, the lowest score is the New York- New Jersey area with 20. 

Salt Lake City, Utah and Austin-round Rock, Texas rank the highest with a score of 37. 

See the rest of the rankings here. 

View Larger +
Prev Next

Forbes

The 2014 state rankings by Forbes has just been released and Rhode Island moved up two spots from #48 in 2013 to #46 in 2014.

What does Forbes say about RI's business environment"

After Michigan and Illinois, Rhode Island has experienced the third worst net migration out of its state in the country over the past five years. With a recent unemployment rate of 7.6%—lower than only Georgia and Mississippi—residents are leaving the state in search of jobs. Rhode Island has been stuck in the bottom five overall for six straight years. One plus: labor costs are 5% below the national average, which stands out in the expensive Northeast.

View Larger +
Prev Next

Tax Foundation

Findings from The State Business Tax Climate Index were released this morning by Tax Foundation which found Rhode Island to have the 45th best tax climate for businesses for 2015. The state's rank has not changed since last year after The Index analyzed 100 different tax variables in multiple categories. 

Read more about the report here

View Larger +
Prev Next

WalletHub

After conducting an online suvery consisting of 1,050 individuals from both parties across the nation, WalletHub ranked Rhode Island as having America's 33rd fairest tax system.

Click here to view the poll's entire findings

View Larger +
Prev Next

Thumbtack/Kauffman

Providence is the second worst city in America for small business, according to a new survey conducted by Thumbtack.com and the Kauffman Foundation.

More than 12,000 small businesses in 82 cities across the country participate in the survey. Providence received an overall "F" grade for small business friendliness.

Full Survey Results Here.

View Larger +
Prev Next

The Economist

Small Business Friendliness Grade: F

The Economist grades states on an A+ to F grading scale for its small business climate.  Rhode Island is one of just 6 states to earn an "F" grade.

Overbearing bureaucracy and excessive licensing is stifling small business in America. 

Read More About The Economist Grade Here

View Larger +
Prev Next

CNBC

CNBC ranks each state in cost of doing business, economy, technology and innovation.

Rhode Island's unemployment rate as of May 2014 was 8.2 percent. This is RI's lowest unemployment rate since August 2008.

Read More About CNBC Ranking Here

View Larger +
Prev Next

Forbes

Forbes ranks each state in business costs, economic climate, and growth prospects. RI is third worst in 2013.

The most damning in the commentary:

After Michigan, Rhode Island has experienced the second worst net migration in the country over the past five years.

Read More About Forbes Ranking Here

View Larger +
Prev Next

ChiefExecutive.net

#39 ChiefExecutive.net

ChiefExecutive.net ranks each state in taxations and regulations, workforce quality, and living environment.

The most damning in the commentary:

Sky-high unemployment rate bespeaks continuing terrible business climate.

Read More About ChiefExecutive.net Ranking Here

View Larger +
Prev Next

Tax Foundation

#46 Tax Foundation

Tax Foundation ranks each state in corporate tax rank, sales tax rank, and unemployment insurance tax rank.

Rhode Island and the other states in the bottom ten suffer from the same afflictions: complex, non-neutral taxes with comparatively high rates.

Read More About Tax Foundation Ranking Here

View Larger +
Prev Next

Wallet Hub

#24 Wallet Hub

Wallet Hub ranks each state in ROI rank, state tax rank, and overall government services.

Rhode Island ranked #50 for worst roads and bridges, but ranked #4 in safety.

Read More About Wallet Hub Ranking Here

View Larger +
Prev Next

ALEC

#47 ALEC

ALEC ranks each state in economic performance and outlook.

Although Rhode Island ranked low in economic performance, a forward-looking forecast is based on the state’s standing in 15 important state policy variables. Some of these variables include top marginal personal income tax rate and sales tax burden.

Read More About ALEC Ranking Here

View Larger +
Prev Next

Kauffman Foundation

#50 Kauffman Foundation

Kauffman Foundation ranks each state in entrepreneurship.

Entrepreneurial activity generally is highest in Western and Southern states
and lowest in Midwestern and Northeastern states.

Read More About Kauffman Ranking Here

View Larger +
Prev Next

Free Enterprise

#47 Free Enterprise

Free Enterprise ranks each state in performance, exports, innovation + entrepreneurship, business climate, talent pipeline, infrastructure.

Rhode Island has continued to feel the direct impact and ripples from the recent recession—it ranks 47th overall in economic performance. However, positive rankings of 15th in talent pipeline and 16th in innovation and entrepreneurship suggest the existence of a foundation on which to build the future.

Read More About Free Enterprise Ranking Here

View Larger +
Prev Next

The Pew Charitable Trusts

#40 The Pew Charitable Trusts

The Pew Charitable Trusts ranks each state in job growth and job creation.

Rhode Island added 6,223 jobs in 2014.

Read More About The Pew Charitable Trusts Ranking Here

View Larger +
Prev Next

Gallup

10th Worst in Gallup's Annual Ranking of State Job Markets 2014

Rhode Island has been ranked 10th worst for job creation in Gallup's annual ranking of state job markets in 2014 with a job creation index number of 21

Rhode Island is one of two (Connecticut) states to rank in the bottom ten each year since 2008.

The 2014 State level findings have were drawn from 201,254 interviews with employed adults across the nation. 

See the full list of rankings here. 


Enjoy this post? Share it with others.


Sign Up for the Daily Eblast

I want to follow on Twitter

I want to Like on Facebook