
URI School of Oceanography to Hold Climate Change Lecture June 2-6
Tuesday, May 13, 2014
The University of Rhode Island Graduate School of Oceanography’s Metcalf Institute for Marine & Environmental Reporting will host its Annual Public Lecture Series, Scientists and Journalists: Getting the Point Across on June 2 through June 6, at the URI Narragansett Bay Campus.

The 2014 Metcalf Institute Lecture Series will bring leading journalists, scientists, and policy experts to URI to explore the latest scientific research and actions being taken to address climate change.
The lectures, which are free and open to the public, will be held at the Coastal Institute Auditorium on the URI Narragansett Bay Campus, 218 South Ferry Road in Narragansett.
GET THE LATEST BREAKING NEWS HERE -- SIGN UP FOR GOLOCAL FREE DAILY EBLASTMonday, June 2, 3:30 p.m.
Covering Climate Change in the Digital Age – Ranked the most prolific climate reporter in the U.S. in 2012, Andrew Freedman covers climate change for Mashable.com, “one of the most engaged digital networks in the world.” Freedman will discuss the challenges of accurately covering extreme weather events in the context of climate change and the opportunities this beat offers for journalistic innovation.
Tuesday, June 3, 3:30 p.m.
The Ocean Acidification Challenge: A pH Balancing Act – Gretchen Hofmann, of the University of California at Santa Barbara, will discuss the latest research on ocean acidification and the potential for marine organisms to adapt to a dramatically altered environment, now and in the future.
Wednesday, June 4, 3:30 p.m.
Building Resilience: How Coastal Communities Can Roll With the Punches – Margaret Davidson, NOAA Office of Ocean and Coastal Resource Management, will describe state and regional efforts to adapt to climate change on U.S. coasts, with a focus on new strategies for building healthy and resilient coastal communities.
Thursday, June 5, 3:30 p.m.
Using Big Data to Understand Earth’s Future – Unprecedented rates of current climate change will force species to either adapt, move, or become extinct, in turn affecting everything from food supply to jobs. Camilo Mora, University of Hawaii, will discuss recent global-scale research to project where and how soon we might see these changes.
Friday, June 6, 11 a.m.
Managing Risk for an Uncertain Future – Howard Kunreuther, University of Pennsylvania Wharton School of Business, will discuss the challenges and uncertainties facing residents, businesses, and government in responding to climate change projections, focusing on the roles of mitigation, adaptation, and insurance in managing catastrophic risks.
The lecture series will coincide with Metcalf Institute’s 16th Annual Science Immersion Workshop for Journalists, a fellowship focusing on climate change reporting.
The Metcalf Fellows, selected from a highly competitive pool of applicants, represent a variety of media organizations ranging from the Los Angeles Times, Israel’s Haaretz, and CQ Roll Call to ecoRI News, an online environmental news outlet, and KCTS, a public TV television station in Seattle, Washington.
Public Invited to Gallery Night at Studio Blue
The URI Graduate School of Oceanography will host an exhibit in the Coastal Institute’s Studio Blue from June 5 to 7, featuring the marine art of Michael Coyne, Kate Huntington, and Dora Atwater Millikin, with sales benefitting the URI Graduate School of Oceanography. The public is invited to a reception with the artists at Studio Blue following the Metcalf Institute public lecture on Thursday, June 5, from 5 p.m. to 8 p.m. RSVP by May 29 at [email protected] or 401-874-6211 to attend the reception. The exhibit continues Friday, June 6, 10 a.m. to 8 p.m., and Saturday, June 7, 10 a.m. to 4 p.m. Get a sneak preview or join the virtual sale, May 26 – June 20, at gso.uri.edu/gallery.
About Metcalf Institute
Metcalf Institute is an internationally recognized leader in providing environmental science training for journalists. The Institute also offers communication workshops for scientists, science resources for journalists and free public lectures on environmental topics. Metcalf Institute was established at the University of Rhode Island’s Graduate School of Oceanography in 1997 with funding from three media foundations: the Belo Corporation, the Providence Journal Charitable Foundation and the Philip L. Graham Fund, with additional support from the Telaka Foundation. Metcalf programming is underwritten by federal and foundation grants, as well as private donations managed by the University of Rhode Island Foundation.
About Studio Blue
Studio Blue, a gallery showcasing the intersection and interaction of science and art, is a collaboration between student and faculty artists from the University of Rhode Island Art department and the Rhode Island School of Design with scientists from the URI Graduate School of Oceanography and the URI College of the Environment and Life Sciences. The collection will expand every year as new artists contribute to an eclectic conversation between art and science. Studio Blue also periodically hosts special exhibitions showcasing marine and environmental art. Located in the Coastal Institute at the Narragansett Bay Campus, Studio Blue is open to the public. Studio Blue is supported and administered by URI GSO, Office of Marine Programs, the Coastal Institute, and the Rhode Island National Science Foundation Experimental Program to Stimulate Competitive Research.
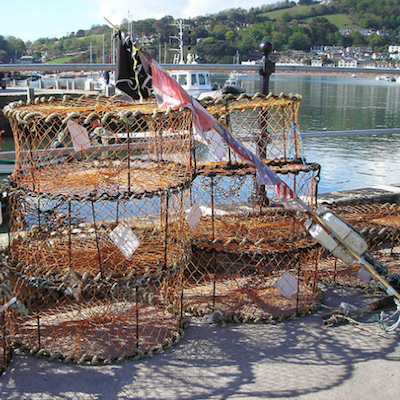
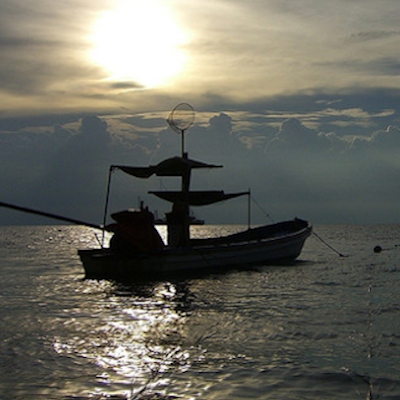
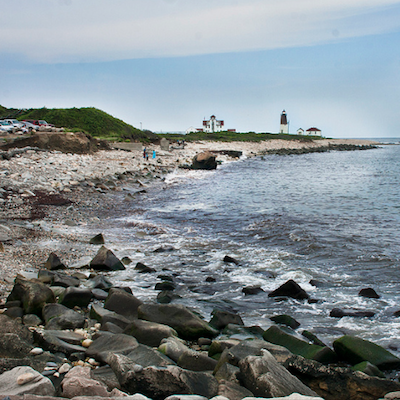
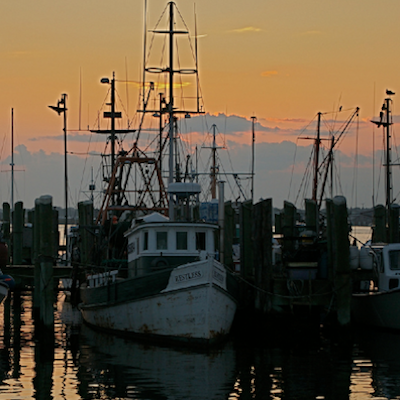
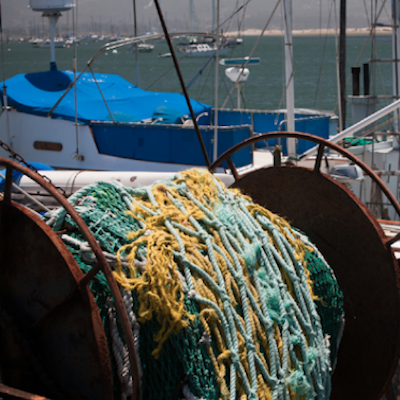
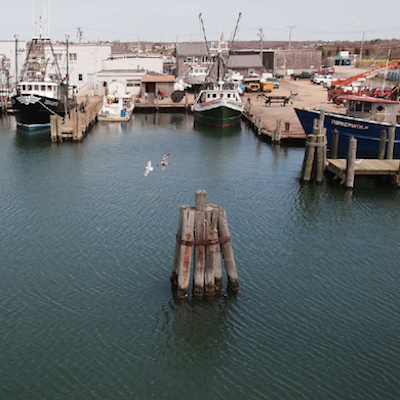
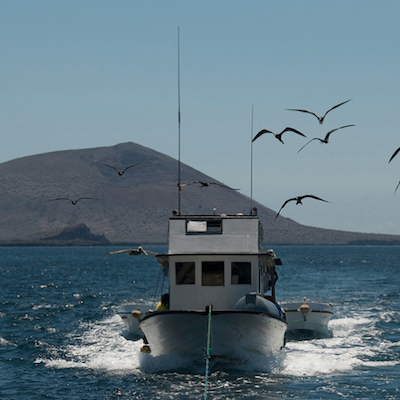
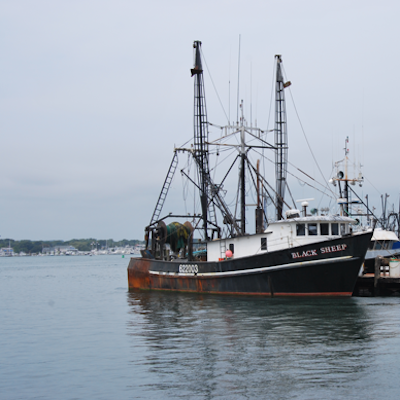
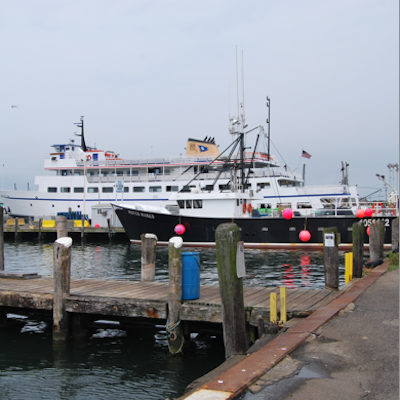
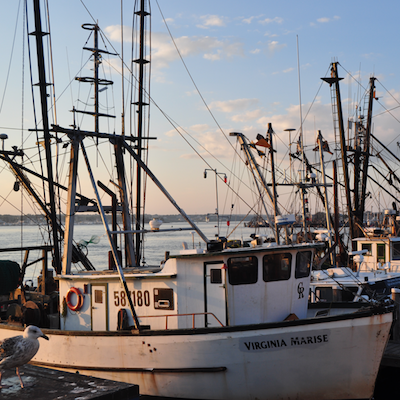
Related Slideshow: RI Fishing Industry’s Decline by the Numbers
The Rhode Island commercial fishing industry is in trouble. A study conducted in 2011 by Cornell University offered a portrait of an industry in crisis, with declines in sales, fishing vessels, and many types of permits. That study also showed how important the preservation of the fishing industry is to the state economy. Below are key figures on the decline and current state of the fishing industry in Rhode Island excerpted from the study. Some data is also taken from the National Oceanic and Atmospheric Administration.


Related Articles
- John Perilli: I Wish Climate Change Were a Hoax, But It’s Not
- Rob Horowitz: Momentum Behind New Action on Climate Change
- States Key to Climate Change, Energy Independence
- NEW: Brown Forum Gives Latin America’s Views on Climate Change
- Rob Horowitz: Obama Administration Launches Promising Climate Change Initiative
- Storms Like Irene Fuel Momentum for Action on Climate Change
- NEW: Kilmartin Joins Multi-State Coalition in Action to Curb Climate Change Pollution
- Rob Horowitz: Obama Moves into High Gear on Climate Change
- Rhode Island Climate Change: EC3 Releases Preliminary Report
- Rob Horowitz: Obama Steps Up on Climate Change
- Rob Horowitz: Climate Change Adaptation Moves on to the Public Agenda
- Rob Horowitz: States Stepping Up On Climate Change
- Chafee Establishes Executive Climate Change Council in Exec. Order
- Rob Horowitz: Climate Change On the Table… Finally!
- Rob Horowitz: Time to Take Action on Climate Change
- GOP’s Huntsman Talks Sense on Climate Change
- Rob Horowitz: Climate Change Put on the Back-Burner
- State Report: Republican Shakeup, RI Loses More Jobs & Climate Change
- Guest MINDSETTER™ Seth Steinman: RI on the Front Line of Climate Change
- Rob Horowitz: Important Climate Change Milestone Exceeded
- State Report: School Safety, Climate Change + Firearm Legislation
