Lardaro Report: Current Conditions Index Rises 9 Points From January

Monday, April 11, 2016


View Larger +

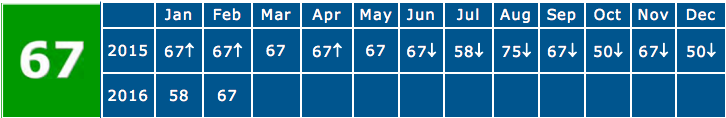
After the discouraging news we received last month concerning labor market data revisions and the resulting changes in our economic performance, comes a bit of a reprieve in February. The Current Conditions index for February rose from its January value of 58 to 67 in February. The good news, as good news here goes, is that this CCI value this month matches the second-highest value from last year, a number we saw for eight of the twelve months in 2015. This also matches last February’s CCI value. 

While the overall CCI for February does reflect improvement from what we witnessed last month, looking “below the hood” one quickly finds that Rhode Island’s overall performance continues to be moderate at best. That is not to say that there were no strong segments of state’s economy, or that none of the CCI’s indicators performed well in February. There were a few. Look at the February growth for Single-Unit Permits: 185.7 percent! Are we returning to the 1980’s? Hardly. A year ago the state had only 17 permits, given our frozen tundra. The value this month rose all the way to 49 (annualized at 588). This traumatized the seasonal adjustment produced a February value of 1,080 units with an amazing growth rate of almost 200 percent. What a tease! 

View Larger +

What we continue to witness, especially in light of the revised data, is that our negatives remain all too present as they continue to blunt the positive momentum that exists here. Central to this is disturbing trends in several of the CCI’s indicators, most notably our state’s Labor Force. While we had been led to believe this indicator was in a well-defined uptrend, the revised data show that the well-defined trend is actually lower. Worse yet, that downtrend has been in place for quite some time now. The February decline of 0.5 percent in our Labor Force was its twentyfirst year-over-year decline. This has major implications for the one statistic that persons in this state continue to be obsessed with: our Unemployment Rate. While this rate has been falling for some time, our shrinking Labor Force indicates that improvements in our jobless rate have been occurring largely for the wrong reasons—not strong job growth, which is the preferred route, but unemployed persons dropping out of the Labor Force. At least we saw a fairly strong performance by our state’s goods-producing sector, unlike what had suggested the beginnings of a prolonged period of weakness. Let’s hope this continues. The weakening US Dollar could prove to be very helpful in sustaining improvement. 

GET THE LATEST BREAKING NEWS HERE -- SIGN UP FOR GOLOCAL FREE DAILY EBLAST

Four of the five leading indicators contained in the CCI improved in February. Total Manufacturing Hours, a measure of manufacturing sector strength, rose by 1.5 percent in February, only its second improvement in a year (versus four with the prior data). Along with this, the Manufacturing Wage declined yet again, this month by 2.4 percent. New home construction, in terms of Single-Unit Permits, rose by 185.7 percent, as stated earlier. Employment Service Jobs, which includes temporary employment and is a prerequisite to employment growth, rose by 1.1 percent, among its slower growth rates in some time. Finally, New Claims, a leading labor market indicator that reflects layoffs, fell by 7.1 percent in February, in spite of a difficult comp one year ago. The lone non-improving leading indicator, US Consumer Sentiment, fell for only its third time in over a year, by 3.8 percent. 

Retail Sales rose in February (2.3% ), reversing its one-time decline in January. This indicator now improved for twenty of the last twenty-one months. Private Service-Producing Employment, an indicator whose actual growth had been slowing, increased by 1.7 percent in February, its most rapid rate of growth since last July. Government Employment fell again (-0.8%), as its level remained just above 60,000. Benefit Exhaustions, which reflects longer-term unemployment, declined by 5 percent relative to last year, its slowest rate of improvement in some time.

During February, Rhode Island turned in a mixed economic performance. We did better than we had in January, a positive, which tied us with the value last year. Beating last year’s value would have been far more significant. However, rates of improvement among virtually all of the indicators that managed to improve (with the exception of Single-Unit Permits) w ere tepid at best. So, as national growth slows, so too does Rhode Island. Unfortunately, it will be necessary for us to institute many structural changes before we can better insulate ourselves from weakening economic growth. “Ordering out” for lists to blindly implement won’t get it done.

View Larger +


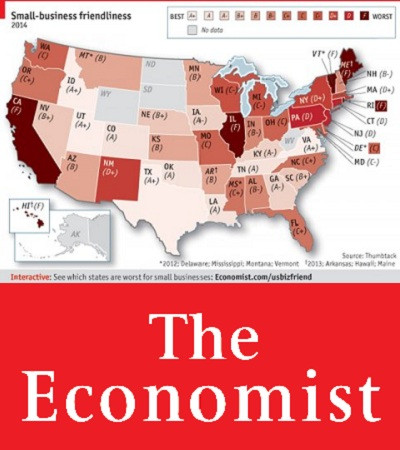
Related Slideshow: RI Business Rankings in US

See how Rhode Island stacked up.

View Larger +
Prev Next

WalletHub

Rhode Island has 2015's eighth highest insurance premium penalties for high risk drivers, according to a WalletHub report. 

Rhode Island ranks fifth overall in the category of speeding over 20 mph annual premium increase at $482. While ranking third overall  in the category of 2 accidents annual premium increase at $2,721.

Rhode Island ranks ninth overall under the reckless driving annual premium increase at $749. 

View Larger +
Prev Next

WalletHub

Rhode Island has been ranked as the 8th most eco-friendly state in the country, according to a recent study by WalletHub.

Rhode Island ranks third in environmental quality and 16th in Eco-Friendly Behaviors Ran landing them in 8th overall.

RI is behind Washington and New Hampshire who are in the six and seven spots respectively, and in front of Connecticut and Hawaii who come in at the nine and ten spot. 

View Larger +
Prev Next

WalletHub

Rhode Island is 2015's 4th Worst State to be a taxpayer, according to a recent WalletHub report. 

Rhode Island ranks 48th of 51 with an average state and local tax price of $7,159 which is good for a 27% difference from the national average. 

The states that are directly behind Rhode Island are Wisconsin at $7,159, Nebraska at $7,298 and Illinois at $7,719 for a 37% difference from the national average.

View Larger +
Prev Next

WalletHub

Rhode Island has the highest vehicle property taxes in the country, paying an average of $1,133 according to a report from WalletHub.

Virginia and Kansas are the two states just ahead of Rhode Island in the 49 and 50 spots, paying $962 and $905 respectively. 

RI also ranks 42nd in average real estate tax, paying an average of $2,779, according to the WalletHub report.

View Larger +
Prev Next

WalletHub

WalletHub has ranked Rhode Island as the 7th worst state to be rich in in a recent in depth analysis of 2015's Best States to be Rich or Poor From a Tax Perspective

On a scale with 1 being the best, and 25 being average, Rhode Island ranks 37th in low income earners, 42 in middle income earners and 45th in high income earners. 

To see the full report, click here. 

View Larger +
Prev Next

Gallup

Providence-metro ranks at the bottom for job creation in 2014  

Rhode Island has been ranked amongst the worst in job creation, according to a recent survey done by Gallup. 

Gallup gives the Prov-metro area an index score of 23, the lowest score is the New York- New Jersey area with 20. 

Salt Lake City, Utah and Austin-round Rock, Texas rank the highest with a score of 37. 

See the rest of the rankings here. 

View Larger +
Prev Next

Forbes

The 2014 state rankings by Forbes has just been released and Rhode Island moved up two spots from #48 in 2013 to #46 in 2014.

What does Forbes say about RI's business environment"

After Michigan and Illinois, Rhode Island has experienced the third worst net migration out of its state in the country over the past five years. With a recent unemployment rate of 7.6%—lower than only Georgia and Mississippi—residents are leaving the state in search of jobs. Rhode Island has been stuck in the bottom five overall for six straight years. One plus: labor costs are 5% below the national average, which stands out in the expensive Northeast.

View Larger +
Prev Next

Tax Foundation

Findings from The State Business Tax Climate Index were released this morning by Tax Foundation which found Rhode Island to have the 45th best tax climate for businesses for 2015. The state's rank has not changed since last year after The Index analyzed 100 different tax variables in multiple categories. 

Read more about the report here

View Larger +
Prev Next

WalletHub

After conducting an online suvery consisting of 1,050 individuals from both parties across the nation, WalletHub ranked Rhode Island as having America's 33rd fairest tax system.

Click here to view the poll's entire findings

View Larger +
Prev Next

Thumbtack/Kauffman

Providence is the second worst city in America for small business, according to a new survey conducted by Thumbtack.com and the Kauffman Foundation.

More than 12,000 small businesses in 82 cities across the country participate in the survey. Providence received an overall "F" grade for small business friendliness.

Full Survey Results Here.

View Larger +
Prev Next

The Economist

Small Business Friendliness Grade: F

The Economist grades states on an A+ to F grading scale for its small business climate.  Rhode Island is one of just 6 states to earn an "F" grade.

Overbearing bureaucracy and excessive licensing is stifling small business in America. 

Read More About The Economist Grade Here

View Larger +
Prev Next

CNBC

CNBC ranks each state in cost of doing business, economy, technology and innovation.

Rhode Island's unemployment rate as of May 2014 was 8.2 percent. This is RI's lowest unemployment rate since August 2008.

Read More About CNBC Ranking Here

View Larger +
Prev Next

Forbes

Forbes ranks each state in business costs, economic climate, and growth prospects. RI is third worst in 2013.

The most damning in the commentary:

After Michigan, Rhode Island has experienced the second worst net migration in the country over the past five years.

Read More About Forbes Ranking Here

View Larger +
Prev Next

ChiefExecutive.net

#39 ChiefExecutive.net

ChiefExecutive.net ranks each state in taxations and regulations, workforce quality, and living environment.

The most damning in the commentary:

Sky-high unemployment rate bespeaks continuing terrible business climate.

Read More About ChiefExecutive.net Ranking Here

View Larger +
Prev Next

Tax Foundation

#46 Tax Foundation

Tax Foundation ranks each state in corporate tax rank, sales tax rank, and unemployment insurance tax rank.

Rhode Island and the other states in the bottom ten suffer from the same afflictions: complex, non-neutral taxes with comparatively high rates.

Read More About Tax Foundation Ranking Here

View Larger +
Prev Next

Wallet Hub

#24 Wallet Hub

Wallet Hub ranks each state in ROI rank, state tax rank, and overall government services.

Rhode Island ranked #50 for worst roads and bridges, but ranked #4 in safety.

Read More About Wallet Hub Ranking Here

View Larger +
Prev Next

ALEC

#47 ALEC

ALEC ranks each state in economic performance and outlook.

Although Rhode Island ranked low in economic performance, a forward-looking forecast is based on the state’s standing in 15 important state policy variables. Some of these variables include top marginal personal income tax rate and sales tax burden.

Read More About ALEC Ranking Here

View Larger +
Prev Next

Kauffman Foundation

#50 Kauffman Foundation

Kauffman Foundation ranks each state in entrepreneurship.

Entrepreneurial activity generally is highest in Western and Southern states
and lowest in Midwestern and Northeastern states.

Read More About Kauffman Ranking Here

View Larger +
Prev Next

Free Enterprise

#47 Free Enterprise

Free Enterprise ranks each state in performance, exports, innovation + entrepreneurship, business climate, talent pipeline, infrastructure.

Rhode Island has continued to feel the direct impact and ripples from the recent recession—it ranks 47th overall in economic performance. However, positive rankings of 15th in talent pipeline and 16th in innovation and entrepreneurship suggest the existence of a foundation on which to build the future.

Read More About Free Enterprise Ranking Here

View Larger +
Prev Next

The Pew Charitable Trusts

#40 The Pew Charitable Trusts

The Pew Charitable Trusts ranks each state in job growth and job creation.

Rhode Island added 6,223 jobs in 2014.

Read More About The Pew Charitable Trusts Ranking Here

View Larger +
Prev Next

Gallup

10th Worst in Gallup's Annual Ranking of State Job Markets 2014

Rhode Island has been ranked 10th worst for job creation in Gallup's annual ranking of state job markets in 2014 with a job creation index number of 21

Rhode Island is one of two (Connecticut) states to rank in the bottom ten each year since 2008.

The 2014 State level findings have were drawn from 201,254 interviews with employed adults across the nation. 

See the full list of rankings here. 


Enjoy this post? Share it with others.


Sign Up for the Daily Eblast

I want to follow on Twitter

I want to Like on Facebook