Gary Sasse: Small Wins Strategy—A Case for Business Tax Reform
Wednesday, April 09, 2014
Gary Sasse, GoLocalProv MINDSETTER
 View Larger +
Once a small win has been realized, forces are unleashed that favors another small win, believes Gary Sasse.
The March employment report shows that U.S. businesses finally added enough jobs to replace the 8.8 million that were lost during the Great Recession. While making gains, Rhode Island has only made-up about one-half of the jobs it saw disappear during the recession.
While the Rhode Island Foundation’s “Make It Happen” initiative has been aimed at jump-starting the economy, the efforts by the State’s public policy makers has not been outstanding.
On a positive note, a Rhode Island Senate report “Rhode To Work’ has focused on several programs to help get Rhode Islanders back to work and prepare them for a changing workplace. For this program to achieve meaningful results it should be funded at scale and be user–friendly. Also the recently elected Speaker has proclaimed the House’s top priority this year would be jobs and the economy.
GET THE LATEST BREAKING NEWS HERE -- SIGN UP FOR GOLOCAL FREE DAILY EBLAST
Last year the General Assembly gave priority to legislation reorganizing the state’s economic development structure. The legislature did not target “bread and butter’ programs to improve the overall business climate. While reorganization was needed, its success is always dependent upon a committed and enthusiastic chief executive. Therefore, it should be no surprise that the majority of organizational modifications were not scheduled to go into effect until the next gubernatorial term. Given the Ocean State’s tepid economic recovery, 2013 may have been a year of lost opportunity.
Small wins strategy
What is urgently needed is a small but significant win that will help reduce the cost of doing business and improve the productivity of the Rhode Island economy. In the classic article Small Wins-Redefining the Scale of Social Problems organizational theorist Karl E. Weick defines a small win “as a concrete, complete, implemented outcome of moderate importance.” Weick goes on to point-out that “Small wins are controllable opportunities to produce visible results.”
Small wins have been designed and implemented in different situations. A struggling football team’s small win of an initial first down has changed the momentum of games and entire seasons. The goal of Alcoholics Anonymous is to stay sober one day at a time. One of the best examples of a leader using a small wins strategy was President Dwight Eisenhower’s approach to building a consensus and reaching a final agreement for the D-Day Invasion.
Small wins strategy works because it produces a consistent pattern of winning. Once a small win has been realized, forces are unleashed that favors another small win. As Coach Paul “Bear” Bryant said; “Winning isn’t everything, but it beats anything that comes in second.” To succeed a small wins strategy must be specific, doable, and have an immediate impact.
Improving RI’s business tax structure
There are several challenges that the General Assembly can address in the coming weeks that can result in small but concrete economic development wins for Rhode Island families and businesses. One of these would be to take meaningful steps to improve Rhode Island’s business tax structure.
Rhode Island’s corporate income tax rate is one of the highest in the nation and the highest in New England. The Tax Foundation’s “Business Tax Climate Index” ranked the Ocean State’s corporate income tax 43rd. A rank of “one” is assigned to the state tax that is the most favorable.
The Rhode Island Division recently issued a study of the state’s corporate income tax structure. Based on tax year 2012 this report found that if the corporate tax used a technique known as combined reporting it could yield somewhere between $20 and $44 million. The exact amount would depend on several factors including the method by which a corporation’s tax liability was calculated.
The current corporate income tax system allows multi-state corporations the ability to shift income out of state to other portions of their operations in states where there is less or no corporate tax. Combined reporting requires that a corporation account for their taxes as single business with the activity of all units counted together. Rhode Island would then use a formula to apportion the amount of the combined income to Rhode Island for tax purposes.
Appointment formula
Rhode Island’s apportionment formula includes three factor—sales, property and payroll. While the apportionment formulas vary among the states, most states use a single sales factor. Analysis indicates that four out of five corporations would either experience no change or a decrease in their tax liability under combined reporting. However, it is particularly important to understand the potential impact of combined reporting and alternative apportionment options on major employers like Amgen and CVS.
If combined reporting is enacted the resulting windfall could be used to reduce the corporate income tax rate from nine percent to either six or seven percent and possibly increase the estate tax exemption.
The future is now
Corporate tax reform is not the only reform needed to enhance Rhode Island’s competitiveness. However, it may be the type of substantive small win that can ignite an economic revival. If the General Assembly means business there is no reason why a decision on business tax reform cannot be made during this legislative session.
Rhode Island’s economic future is now.
Gary Sasse is Founding Director of the Hassenfeld Institute for Public Leadership at Bryant University. He is the former Executive Director Rhode Island Public Expenditure and Director of the Departments of Administration and Revenue.
Related Slideshow: Smallest + Largest Tax Increases in RI
Below are the largest—and smallest—tax increases in Rhode Island cities and towns for fiscal year 2014. The data measures the overall change in the amount levied in taxes between last year and this year. It does not compare changes in individual tax rates for homeowners, which may have been higher than the overall increase if the change in the rates was lower for another group of taxpayers in the community. This year, for the first time, all communities stayed below the annual tax cap, which for 2014 was 4 percent. (The cap applies to the overall levy not individual tax rates. Note that the levies for any independent fire districts in a community are not included.) Below communities are ranked starting with those that had the lowest increases. Data was provided by the state Division of Municipal Finance and is current as of January 7.
 View Larger +
Prev
Next
#39
Pawtucket
FY 2013 to FY 2014 Tax Increase: -0.68%
Rank: 39
FY 2013 Tax Levy: $100,068,109
FY 2014 Tax Levy: $99,386,793
Amount of Increase: -$681,316
 View Larger +
Prev
Next
#38
Hopkinton
FY 2013 to FY 2014 Tax Increase: -0.40%
Rank: 38
FY 2013 Tax Levy: $18,300,511
FY 2014 Tax Levy: $18,228,199
Amount of Increase: -$72,312
Note: Has an independent fire district. Levy for fire districts not included.
 View Larger +
Prev
Next
#37
Cranston
FY 2013 to FY 2014 Tax Increase: 0.12%
Rank: 37
FY 2013 Tax Levy: $181,367,888
FY 2014 Tax Levy: $181,591,060
Amount of Increase: $223,172
 View Larger +
Prev
Next
#36
Jamestown
FY 2013 to FY 2014 Tax Increase: 0.37%
Rank: 36
FY 2013 Tax Levy: $19,089,398
FY 2014 Tax Levy: $19,160,796
Amount of Increase: $71,398
 View Larger +
Prev
Next
#35
North Providence
FY 2013 to FY 2014 Tax Increase: 0.40%
Rank: 35
FY 2013 Tax Levy: $67,468,778
FY 2014 Tax Levy: $67,737,041
Amount of Increase: $268,263
 View Larger +
Prev
Next
#34
Glocester
FY 2013 to FY 2014 Tax Increase: 0.41%
Rank: 34
FY 2013 Tax Levy: $20,666,156
FY 2014 Tax Levy: $20,750,248
Amount of Increase: $84,092
Note: Has an independent fire district. Levy for fire districts not included.
 View Larger +
Prev
Next
#33
West Greenwich
FY 2013 to FY 2014 Tax Increase: 0.42%
Rank: 33
FY 2013 Tax Levy: $17,700,512
FY 2014 Tax Levy: $17,775,266
Amount of Increase: $74,754
 View Larger +
Prev
Next
#32
Foster
FY 2013 to FY 2014 Tax Increase: 0.56%
Rank: 32
FY 2013 Tax Levy: $11,206,523
FY 2014 Tax Levy: $11,269,380
Amount of Increase: $62,857
 View Larger +
Prev
Next
#31
Warren
FY 2013 to FY 2014 Tax Increase: 0.57%
Rank: 31
FY 2013 Tax Levy: $21,962,605
FY 2014 Tax Levy: $22,087,246
Amount of Increase: $124,641
 View Larger +
Prev
Next
#30
Barrington
FY 2013 to FY 2014 Tax Increase: 0.66%
Rank: 30
FY 2013 Tax Levy: $55,757,749
FY 2014 Tax Levy: $56,127,312
Amount of Increase: $369,563
 View Larger +
Prev
Next
#29
South Kingstown
FY 2013 to FY 2014 Tax Increase: 1.03%
Rank: 29
FY 2013 Tax Levy: $66,399,782
FY 2014 Tax Levy: $67,082,117
Amount of Increase: $682,335
 View Larger +
Prev
Next
#28
Lincoln
FY 2013 to FY 2014 Tax Increase: 1.08%
Rank: 28
FY 2013 Tax Levy: $51,933,416
FY 2014 Tax Levy: $52,492,287
Amount of Increase: $558,871
Note: Has an independent fire district. Levy for fire districts not included.
 View Larger +
Prev
Next
#27
North Kingstown
FY 2013 to FY 2014 Tax Increase: 1.37%
Rank: 27
FY 2013 Tax Levy: $69,092,073
FY 2014 Tax Levy: $70,035,857
Amount of Increase: $943,784
 View Larger +
Prev
Next
#26
Cumberland
FY 2013 to FY 2014 Tax Increase: 1.53%
Rank: 26
FY 2013 Tax Levy: $59,560,610
FY 2014 Tax Levy: $60,472,810
Amount of Increase: $912,200
Note: Has an independent fire district. Levy for fire districts not included. Cumberland actual amount is an estimate reported by the town. Final levy will be set in May 2014
 View Larger +
Prev
Next
#25
Warwick
FY 2013 to FY 2014 Tax Increase: 1.57%
Rank: 25
FY 2013 Tax Levy: $220,300,865
FY 2014 Tax Levy: $223,763,444
Amount of Increase: $3,462,579
 View Larger +
Prev
Next
#24
Little Compton
FY 2013 to FY 2014 Tax Increase: 1.74%
Rank: 24
FY 2013 Tax Levy: $10,153,215
FY 2014 Tax Levy: $10,329,739
Amount of Increase: $176,524
 View Larger +
Prev
Next
#23
East Providence
FY 2013 to FY 2014 Tax Increase: 1.91%
Rank: 23
FY 2013 Tax Levy: $101,738,436
FY 2014 Tax Levy: $103,679,393
Amount of Increase: $1,940,957
Note: East Providence fiscal year is Nov. 1 to Oct. 31. Figures represent an state estimate which will be finalized in spring 2014.
 View Larger +
Prev
Next
#22
Westerly
FY 2013 to FY 2014 Tax Increase: 1.93%
Rank: 22
FY 2013 Tax Levy: $64,073,479
FY 2014 Tax Levy: $65,309,605
Amount of Increase: $1,236,126
Note: Has an independent fire district. Levy for fire districts not included.
 View Larger +
Prev
Next
#21
Middletown
FY 2013 to FY 2014 Tax Increase: 1.95%
Rank: 21
FY 2013 Tax Levy: $42,569,846
FY 2014 Tax Levy: $43,400,329
Amount of Increase: $830,483
 View Larger +
Prev
Next
#20
Charlestown
FY 2013 to FY 2014 Tax Increase: 1.95%
Rank: 20
FY 2013 Tax Levy: $22,244,817
FY 2014 Tax Levy: $22,679,022
Amount of Increase: $434,205
Note: Has an independent fire district. Levy for fire districts not included.
 View Larger +
Prev
Next
#19
Tiverton
FY 2013 to FY 2014 Tax Increase: 2.22%
Rank: 19
FY 2013 Tax Levy: $36,705,787
FY 2014 Tax Levy: $37,519,924
Amount of Increase: $814,137
Note: Has an independent fire district. Levy for fire districts not included.
 View Larger +
Prev
Next
#18
Narragansett
FY 2013 to FY 2014 Tax Increase: 2.25%
Rank: 18
FY 2013 Tax Levy: $45,045,014
FY 2014 Tax Levy: $46,060,213
Amount of Increase: $1,015,199
Note: Has an independent fire district. Levy for fire districts not included.
 View Larger +
Prev
Next
#17
Portsmouth
FY 2013 to FY 2014 Tax Increase: 2.41%
Rank: 17
FY 2013 Tax Levy: $46,892,274
FY 2014 Tax Levy: $48,021,889
Amount of Increase: $1,129,615
Note: Has an independent fire district. Levy for fire districts not included.
 View Larger +
Prev
Next
#16
Providence
FY 2013 to FY 2014 Tax Increase: 2.42%
Rank: 16
FY 2013 Tax Levy: $332,768,119
FY 2014 Tax Levy: $340,814,523
Amount of Increase: $8,046,404
Photo: Flickr/thurdl01
 View Larger +
Prev
Next
#15
Smithfield
FY 2013 to FY 2014 Tax Increase: 2.43%
Rank: 15
FY 2013 Tax Levy: $50,485,821
FY 2014 Tax Levy: $51,713,919
Amount of Increase: $1,228,098
 View Larger +
Prev
Next
#14
Scituate
FY 2013 to FY 2014 Tax Increase: 2.63%
Rank: 14
FY 2013 Tax Levy: $25,737,325
FY 2014 Tax Levy: $26,415,040
Amount of Increase: $677,715
Note: Scituate fiscal year is April 1 to March 31.
 View Larger +
Prev
Next
#13
Johnston
FY 2013 to FY 2014 Tax Increase: 2.73%
Rank: 13
FY 2013 Tax Levy: $68,325,207
FY 2014 Tax Levy: $70,191,873
Amount of Increase: $1,866,666
 View Larger +
Prev
Next
#12
Exeter
FY 2013 to FY 2014 Tax Increase: 2.76%
Rank: 12
FY 2013 Tax Levy: $12,699,098
FY 2014 Tax Levy: $13,048,989
Amount of Increase: $349,891
Note: Has an independent fire district. Levy for fire districts not included.
 View Larger +
Prev
Next
#11
Bristol
FY 2013 to FY 2014 Tax Increase: 3.20%
Rank: 11
FY 2013 Tax Levy: $35,907,363
FY 2014 Tax Levy: $37,055,367
Amount of Increase: $1,148,004
 View Larger +
Prev
Next
#10
Richmond
FY 2013 to FY 2014 Tax Increase: 3.39%
Rank: 10
FY 2013 Tax Levy: $16,192,073
FY 2014 Tax Levy: $16,740,541
Amount of Increase: $548,468
Photo: Flickr/peppergrasss
 View Larger +
Prev
Next
#9
Newport
FY 2013 to FY 2014 Tax Increase: 3.49%
Rank: 9
FY 2013 Tax Levy: $65,177,966
FY 2014 Tax Levy: $67,451,455
Amount of Increase: $2,273,489
Photo: Flickr/Jasperdo
 View Larger +
Prev
Next
#8
Coventry
FY 2013 to FY 2014 Tax Increase: 3.56%
Rank: 8
FY 2013 Tax Levy: $62,327,613
FY 2014 Tax Levy: $64,549,069
Amount of Increase: $2,221,455
Note: Has an independent fire district. Levy for fire districts not included.
 View Larger +
Prev
Next
#7
Burrillville
FY 2013 to FY 2014 Tax Increase: 3.63%
Rank: 7
FY 2013 Tax Levy: $27,830,582
FY 2014 Tax Levy: $28,840,267
Amount of Increase: $1,009,685
Note: Has an independent fire district. Levy for fire districts not included.
 View Larger +
Prev
Next
#6
North Smithfield
FY 2013 to FY 2014 Tax Increase: 3.82%
Rank: 6
FY 2013 Tax Levy: $28,611,366
FY 2014 Tax Levy: $29,705,309
Amount of Increase: $1,093,943
 View Larger +
Prev
Next
#5
New Shoreham
FY 2013 to FY 2014 Tax Increase: 3.85%
Rank: 5
FY 2013 Tax Levy: $8,400,360
FY 2014 Tax Levy: $8,723,934
Amount of Increase: $323,574
 View Larger +
Prev
Next
#4
West Warwick
FY 2013 to FY 2014 Tax Increase: 3.89%
Rank: 4
FY 2013 Tax Levy: $54,252,606
FY 2014 Tax Levy: $56,363,626
Amount of Increase: $2,111,020
 View Larger +
Prev
Next
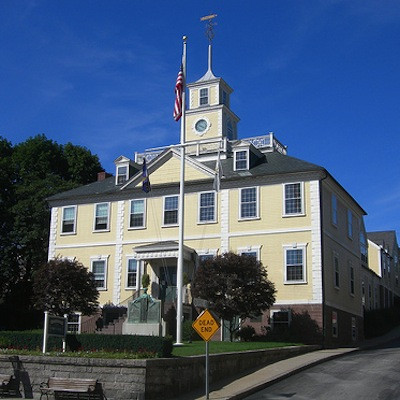
#3
East Greenwich
FY 2013 to FY 2014 Tax Increase: 3.91%
Rank: 3
FY 2013 Tax Levy: $49,896,853
FY 2014 Tax Levy: $51,845,789
Amount of Increase: $1,948,936
Note: East Greenwich fiscal year 2013 & 2014 levies reflect the towns merger with the fire district in June 2013.
Photo: Flickr/Jimmy Wayne
 View Larger +
Prev
Next
#2
Woonsocket
FY 2013 to FY 2014 Tax Increase: 3.99%
Rank: 2
FY 2013 Tax Levy: $57,588,098
FY 2014 Tax Levy: $59,888,228
Amount of Increase: $2,300,130
Note: Woonsocket fiscal year 2013 includes a supplemental tax.
 View Larger +
Prev
Next
#1
Central Falls
FY 2013 to FY 2014 Tax Increase: 4.00%
Rank: 1
FY 2013 Tax Levy: $13,674,638
FY 2014 Tax Levy: $14,221,500
Amount of Increase: $546,862
Related Articles
Enjoy this post? Share it with others.